QUESTION IMAGE
Question
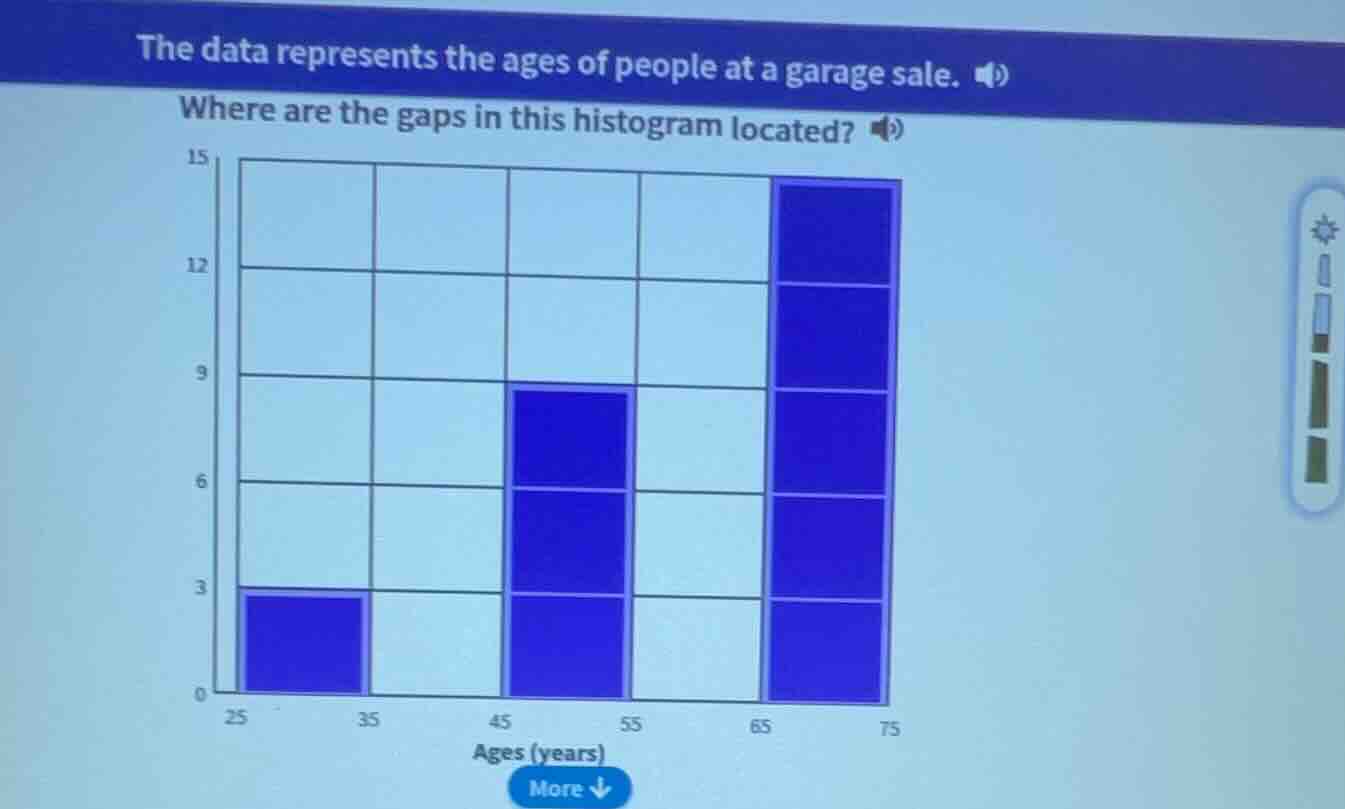
the data represents the ages of people at a garage sale. where are the gaps in this histogram located?
Step1: Identify histogram intervals
The histogram has age intervals: 25 - 35, 35 - 45, 45 - 55, 55 - 65, 65 - 75.
Step2: Check for gaps (no data)
- Interval 35 - 45: No blue bar (no data).
- Interval 55 - 65: No blue bar (no data).

Snap & solve any problem in the app
Get step-by-step solutions on Sovi AI
Photo-based solutions with guided steps
Explore more problems and detailed explanations
Gaps are in the age intervals 35–45 years and 55–65 years.