QUESTION IMAGE
Question
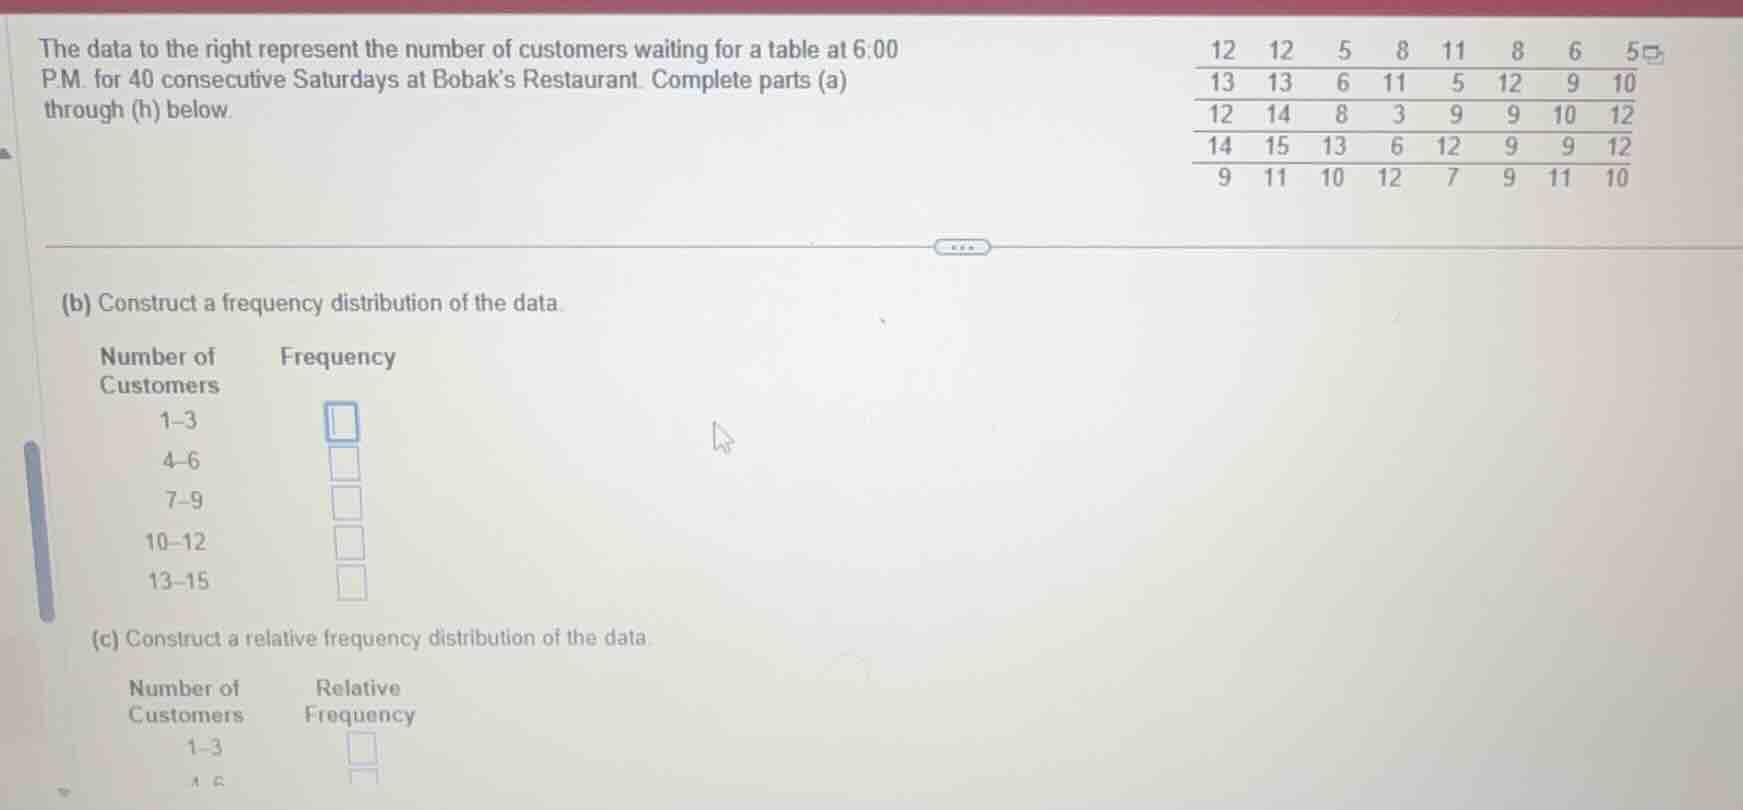
the data to the right represent the number of customers waiting for a table at 6:00 p.m. for 40 consecutive saturdays at bobak’s restaurant. complete parts (a) through (h) below.
(b) construct a frequency distribution of the data.
number of customers
1–3
4–6
7–9
10–12
13–15
frequency
(c) construct a relative frequency distribution of the data.
number of customers
1–3
relative frequency
Step1: List all data points
Data set: 12,12,5,8,11,8,6,5,13,13,6,11,5,12,9,10,12,14,8,3,9,9,10,12,14,15,13,6,12,9,9,12,9,11,10,12,7,9,11,10
Step2: Tally frequencies for 1-3
Count values in [1,3]: only 3 → Frequency = 1
Step3: Tally frequencies for 4-6
Count values in [4,6]: 5,6,5,6,5,6 → Frequency = 6
Step4: Tally frequencies for 7-9
Count values in [7,9]: 8,8,9,8,9,9,9,9,7,9 → Frequency = 10
Step5: Tally frequencies for 10-12
Count values in [10,12]: 12,12,11,12,10,12,10,12,12,12,10,12,11,10,11 → Frequency = 19
Step6: Tally frequencies for 13-15
Count values in [13,15]: 13,13,14,14,15,13 → Frequency = 4
Step7: Calculate relative frequencies
Relative frequency = $\frac{\text{Frequency}}{40}$
- 1-3: $\frac{1}{40}=0.025$
- 4-6: $\frac{6}{40}=0.15$
- 7-9: $\frac{10}{40}=0.25$
- 10-12: $\frac{19}{40}=0.475$
- 13-15: $\frac{4}{40}=0.1$

Snap & solve any problem in the app
Get step-by-step solutions on Sovi AI
Photo-based solutions with guided steps
Explore more problems and detailed explanations
Part (b) Frequency Distribution
| Number of Customers | Frequency |
|---|---|
| 4-6 | 6 |
| 7-9 | 10 |
| 10-12 | 19 |
| 13-15 | 4 |
Part (c) Relative Frequency Distribution
| Number of Customers | Relative Frequency |
|---|---|
| 4-6 | 0.15 |
| 7-9 | 0.25 |
| 10-12 | 0.475 |
| 13-15 | 0.1 |