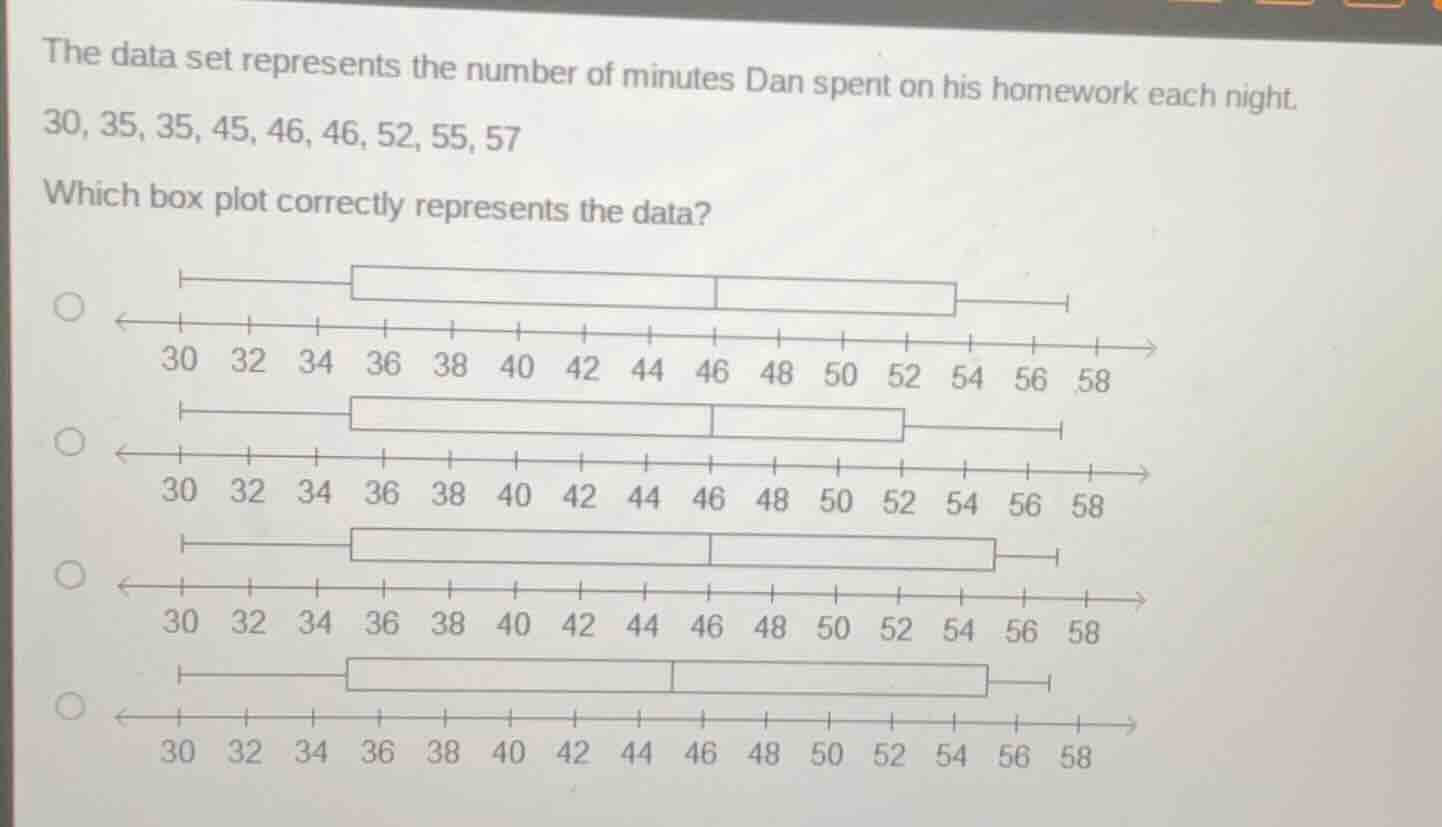
QUESTION IMAGE
Question
the data set represents the number of minutes dan spent on his homework each night.
30, 35, 35, 45, 46, 46, 52, 55, 57
which box plot correctly represents the data?
four box plot options with number lines from 30 to 58, each with different box and whisker positions
Step1: Find minimum value
Minimum = 30
Step2: Find maximum value
Maximum = 57
Step3: Calculate median (2nd quartile)
Data set: 30, 35, 35, 45, 46, 46, 52, 55, 57
Median = 5th value = 46
Step4: Calculate 1st quartile (Q1)
Lower half: 30, 35, 35, 45
Q1 = median of lower half = $\frac{35+35}{2}=35$
Step5: Calculate 3rd quartile (Q3)
Upper half: 46, 52, 55, 57
Q3 = median of upper half = $\frac{52+55}{2}=53.5$

Snap & solve any problem in the app
Get step-by-step solutions on Sovi AI
Photo-based solutions with guided steps
Explore more problems and detailed explanations
The correct box plot is the one with:
- Left whisker at 30, right whisker at 57
- Left box edge (Q1) at 35, right box edge (Q3) at 53.5
- Median line at 46
(This corresponds to the first option in the image)