QUESTION IMAGE
Question
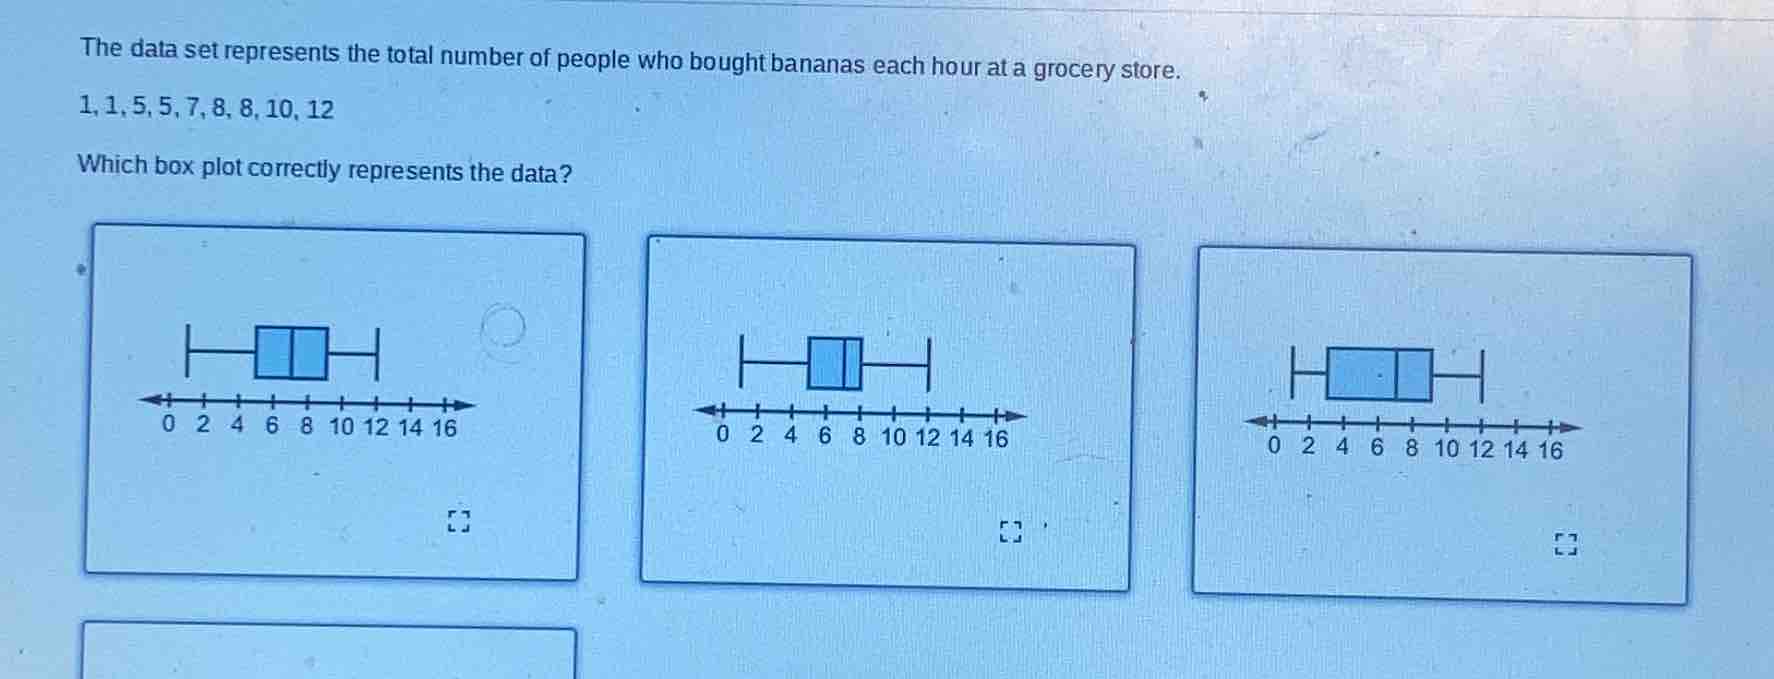
the data set represents the total number of people who bought bananas each hour at a grocery store.
1,1,5,5,7,8,8,10,12
which box plot correctly represents the data?
Step1: Find the minimum and maximum
The data set is \(1, 1, 5, 5, 7, 8, 8, 10, 12\). The minimum value is \(1\) and the maximum value is \(12\).
Step2: Find the median (Q2)
There are \(9\) data points. The median is the middle value, which is the \(5\)-th value. Sorting the data: \(1, 1, 5, 5, 7, 8, 8, 10, 12\). The \(5\)-th value is \(7\)? Wait, no, wait: \(n = 9\), so the median is at position \(\frac{9 + 1}{2}=5\)-th term. Wait, the data is \(1, 1, 5, 5, 7, 8, 8, 10, 12\). So the 5th term is \(7\)? Wait, no, wait, let's count: 1 (1st), 1 (2nd), 5 (3rd), 5 (4th), 7 (5th), 8 (6th), 8 (7th), 10 (8th), 12 (9th). So median (Q2) is \(7\)? Wait, no, wait, maybe I made a mistake. Wait, the number of data points is \(9\), so the median is the \((9 + 1)/2 = 5\)-th term. So yes, the 5th term is \(7\). Wait, but let's check the quartiles.
Step3: Find Q1 (median of lower half)
The lower half of the data (excluding the median) is \(1, 1, 5, 5\). There are \(4\) data points, so the median of the lower half is the average of the 2nd and 3rd terms. The 2nd term is \(1\), the 3rd term is \(5\). So Q1 \(=\frac{1 + 5}{2}=3\)? Wait, no, wait, the lower half is the first \(4\) terms: \(1, 1, 5, 5\). The median of these \(4\) terms is the average of the 2nd and 3rd terms. So \((1 + 5)/2 = 3\). So Q1 is \(3\).
Step4: Find Q3 (median of upper half)
The upper half of the data (excluding the median) is \(8, 8, 10, 12\). There are \(4\) data points, so the median of the upper half is the average of the 2nd and 3rd terms. The 2nd term is \(8\), the 3rd term is \(10\). So Q3 \(=\frac{8 + 10}{2}=9\).
Wait, but let's re-examine the data. Wait, the data is \(1, 1, 5, 5, 7, 8, 8, 10, 12\). Let's confirm:
- Minimum: \(1\)
- Q1: median of \(1, 1, 5, 5\). The middle two are \(1\) and \(5\), so Q1 \(=(1 + 5)/2 = 3\)
- Median (Q2): \(7\) (the 5th term)
- Q3: median of \(8, 8, 10, 12\). The middle two are \(8\) and \(10\), so Q3 \(=(8 + 10)/2 = 9\)
- Maximum: \(12\)
Wait, but let's check the box plots. The first box plot: let's see the whiskers. The minimum is \(1\), maximum is \(12\). The box should start at Q1, end at Q3, with the median inside. Wait, maybe I made a mistake in Q1 and Q3. Wait, another way: for a data set with \(n\) elements, the position of Q1 is \(\frac{n + 1}{4}\), and Q3 is \(\frac{3(n + 1)}{4}\) when \(n\) is odd? Wait, \(n = 9\), so Q1 position is \((9 + 1)/4 = 2.5\)-th term. So the 2.5-th term is the average of the 2nd and 3rd terms. The 2nd term is \(1\), the 3rd term is \(5\), so \((1 + 5)/2 = 3\), which matches. Q3 position is \(3(9 + 1)/4 = 7.5\)-th term. The 7.5-th term is the average of the 7th and 8th terms. The 7th term is \(8\), the 8th term is \(10\), so \((8 + 10)/2 = 9\), which matches. So the box plot should have:
- Minimum: \(1\)
- Q1: \(3\)
- Median: \(7\)
- Q3: \(9\)
- Maximum: \(12\)
Now let's look at the box plots. The first box plot: let's see the x-axis. The first box plot has whiskers from \(1\) to \(12\), the box from, say, \(3\) to \(9\), with median at \(7\). Let's check the options. The first box plot: the left whisker starts at \(1\), the box starts at \(3\) (Q1), the median line at \(7\), the box ends at \(9\) (Q3), and the right whisker ends at \(12\). That matches our calculations. Wait, but let's check the other box plots. The second box plot: maybe Q1 is different. The third box plot: maybe Q1 is higher. So the correct box plot should have minimum \(1\), Q1 \(3\), median \(7\), Q3 \(9\), maximum \(12\). So the first box plot (the leftmost one) should be the correct one.

Snap & solve any problem in the app
Get step-by-step solutions on Sovi AI
Photo-based solutions with guided steps
Explore more problems and detailed explanations
The first box plot (the left - most one with whiskers from 1 to 12, box from 3 to 9, and median at 7) correctly represents the data. (Assuming the first box plot in the given options has these characteristics. If we need to identify with the given option labels, but since the options are not labeled with A, B, C, but from the description, the first box plot as per the left - most in the image is the correct one.)