QUESTION IMAGE
Question
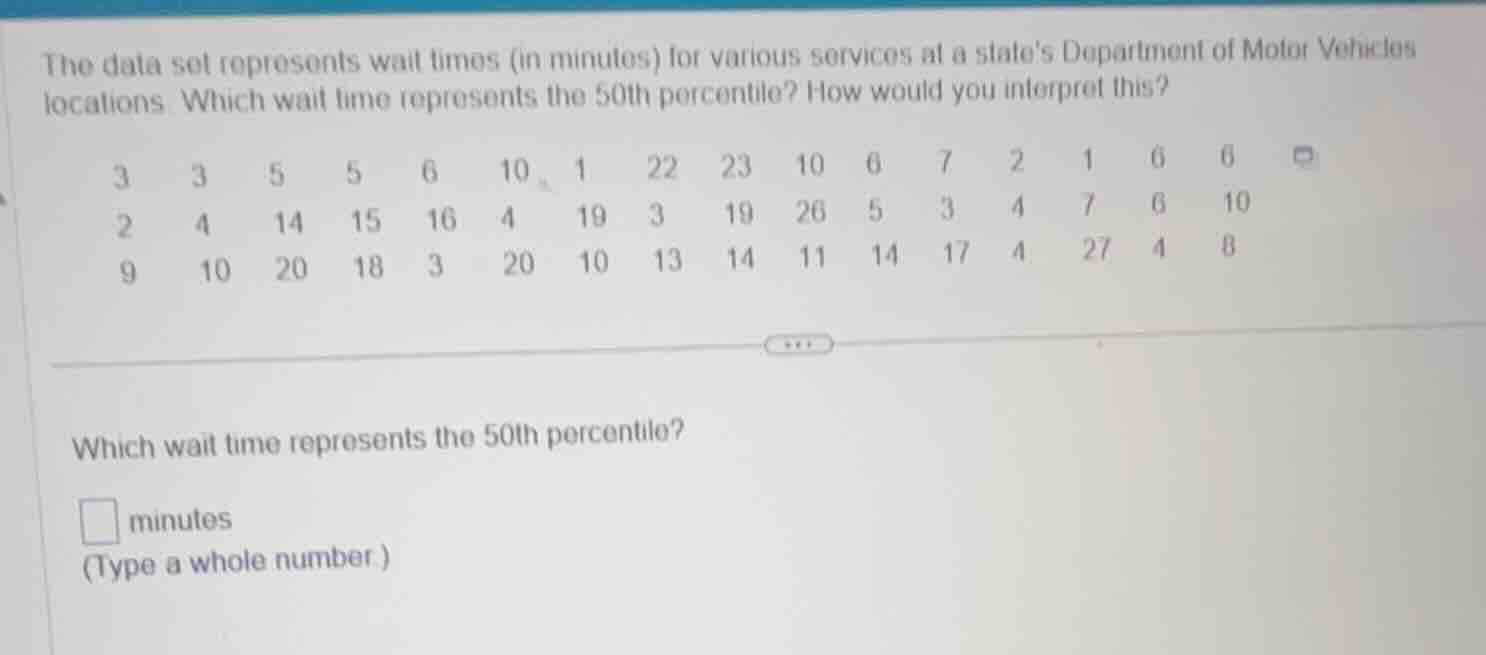
the data set represents wait times (in minutes) for various services at a states department of motor vehicles locations. which wait time represents the 50th percentile? how would you interpret this?3 3 5 5 6 10 1 22 23 10 6 7 2 1 6 62 4 14 15 16 4 19 3 19 26 5 3 4 7 6 109 10 20 18 3 20 10 13 14 11 14 17 4 27 4 8which wait time represents the 50th percentile?□ minutes(type a whole number.)
Step1: Count total data points
Count all values: there are 45 data points.
Step2: Calculate percentile position
Use formula for percentile rank: $i = \frac{P}{100} \times n$, where $P=50$, $n=45$.
$i = \frac{50}{100} \times 45 = 22.5$
Step3: Round up to integer position
Round $22.5$ up to 23 (since $i$ is not integer, we use the next integer).
Step4: Sort data and find 23rd value
Sorted data (ascending):
1, 1, 2, 2, 3, 3, 3, 3, 3, 4, 4, 4, 4, 4, 5, 5, 5, 6, 6, 6, 6, 7, 7, 8, 9, 10, 10, 10, 10, 10, 11, 13, 14, 14, 14, 15, 16, 17, 18, 19, 19, 20, 20, 22, 23, 26, 27
The 23rd value is 7.
Step5: Interpret the percentile
The 50th percentile means 50% of wait times are ≤ this value, and 50% are ≥ this value.

Snap & solve any problem in the app
Get step-by-step solutions on Sovi AI
Photo-based solutions with guided steps
Explore more problems and detailed explanations
7 minutes
Interpretation: 50% of the wait times at the DMV are 7 minutes or less, and 50% are 7 minutes or more.