QUESTION IMAGE
Question
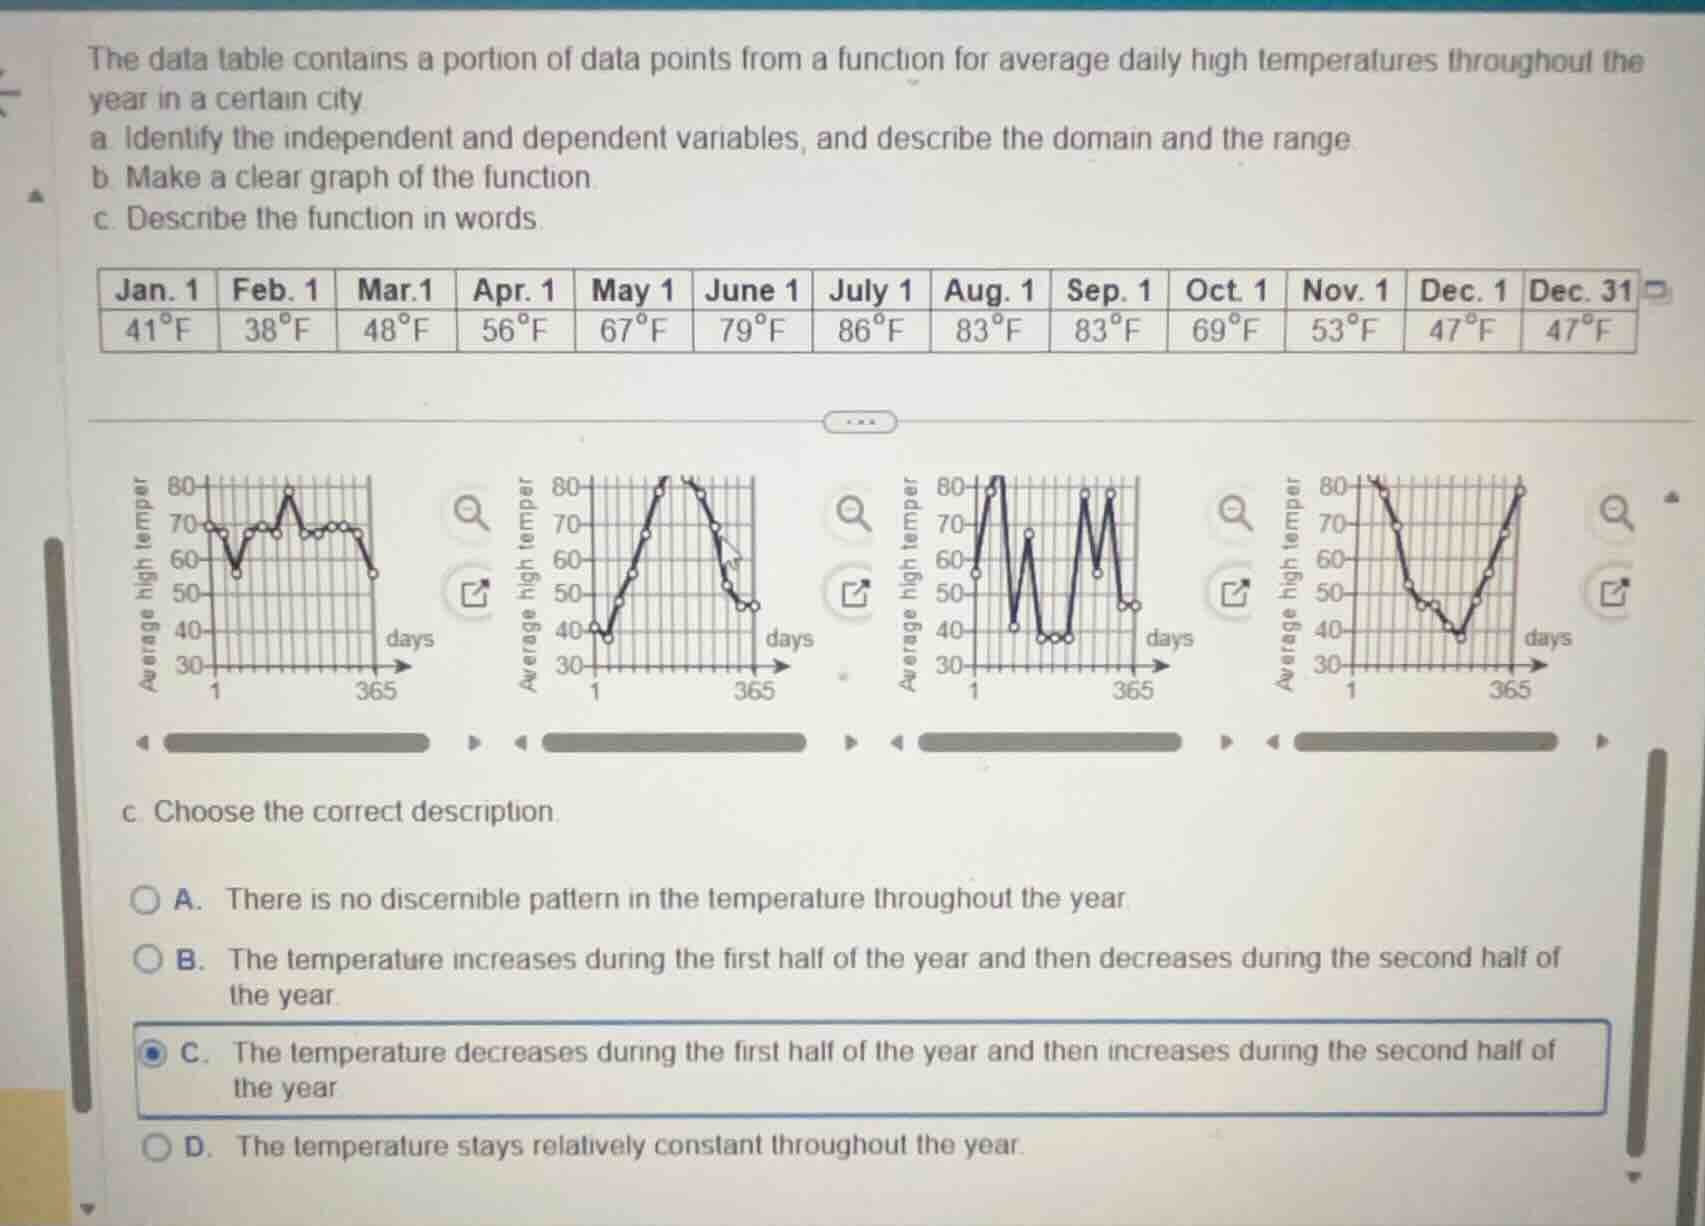
the data table contains a portion of data points from a function for average daily high temperatures throughout the year in a certain city
a. identify the independent and dependent variables, and describe the domain and the range
b. make a clear graph of the function
c. describe the function in words.
jan. 1 feb. 1 mar.1 apr. 1 may 1 june 1 july 1 aug. 1 sep. 1 oct 1 nov. 1 dec. 1 dec. 31
41°f 38°f 48°f 56°f 67°f 79°f 86°f 83°f 83°f 69°f 53°f 47°f 47°f
c. choose the correct description.
a. there is no discernible pattern in the temperature throughout the year.
b. the temperature increases during the first half of the year and then decreases during the second half of the year.
c. the temperature decreases during the first half of the year and then increases during the second half of the year
d. the temperature stays relatively constant throughout the year.
Part (a)
Step1: Identify Variables
The independent variable is time (represented by the dates/days of the year), as it is the variable we can control or that progresses independently. The dependent variable is the average daily high temperature, as it depends on the time of the year.
Step2: Determine Domain
The domain is the set of all possible input values (time). Since we are looking at temperatures throughout the year, the domain is the set of days from January 1 to December 31, or in terms of a function, the domain is all real numbers (or days) representing the time within a year, typically from \(1\) (Jan 1) to \(365\) (Dec 31) (or \(366\) for leap years, but here we have Dec 31 as a data point, so domain is \(\{1, 2, \dots, 365\}\) or the interval \([1, 365]\) if we consider continuous time).
Step3: Determine Range
The range is the set of all possible output values (temperatures). From the data, the temperatures are \(38^\circ\text{F}, 41^\circ\text{F}, 47^\circ\text{F}, 48^\circ\text{F}, 53^\circ\text{F}, 56^\circ\text{F}, 67^\circ\text{F}, 79^\circ\text{F}, 83^\circ\text{F}, 86^\circ\text{F}, 69^\circ\text{F}\). So the range is the set of these temperatures, or in interval notation, approximately \([38, 86]\) (in degrees Fahrenheit), considering the minimum and maximum values from the data.
Part (b)
To make the graph:
- X - axis: Represent the days of the year (from 1 to 365, with labels for key dates like Jan 1, Feb 1, etc.).
- Y - axis: Represent the average daily high temperature (in degrees Fahrenheit).
- Plot Points: For each date (Jan 1, Feb 1, ..., Dec 31), plot the corresponding temperature. For example, plot (1, 41), (32, 38) (since Feb 1 is 31 days after Jan 1, so day 32), (60, 48) (Mar 1 is about 60 days after Jan 1), and so on. Then connect the points with a line to show the trend.
Part (c)
Looking at the temperature data: From Jan 1 (\(41^\circ\text{F}\)) to Feb 1 (\(38^\circ\text{F}\)) there is a slight decrease, then from Feb 1 to July 1, the temperature generally increases (Feb 1: \(38^\circ\text{F}\), Mar 1: \(48^\circ\text{F}\), Apr 1: \(56^\circ\text{F}\), May 1: \(67^\circ\text{F}\), June 1: \(79^\circ\text{F}\), July 1: \(86^\circ\text{F}\)). After July 1, from July 1 to Dec 31, the temperature generally decreases (July 1: \(86^\circ\text{F}\), Aug 1: \(83^\circ\text{F}\), Sep 1: \(83^\circ\text{F}\), Oct 1: \(69^\circ\text{F}\), Nov 1: \(53^\circ\text{F}\), Dec 1: \(47^\circ\text{F}\), Dec 31: \(47^\circ\text{F}\)). Wait, no, actually, the first half of the year (Jan 1 to June 30) shows an overall increase (from \(38^\circ\text{F}\) (Feb 1) up to \(86^\circ\text{F}\) (July 1)), and the second half (July 1 to Dec 31) shows a decrease (from \(86^\circ\text{F}\) down to \(47^\circ\text{F}\)). Wait, the initial data: Jan 1: 41, Feb 1: 38 (decrease), then Mar 1: 48 (increase from Feb 1), Apr 1: 56 (increase), May 1: 67 (increase), June 1: 79 (increase), July 1: 86 (increase), then Aug 1: 83 (decrease from July 1), Sep 1: 83 (same as Aug 1), Oct 1: 69 (decrease), Nov 1: 53 (decrease), Dec 1: 47 (decrease), Dec 31: 47 (same as Dec 1). So overall, the temperature increases from Feb 1 (or Jan 1 with a small dip) up to July 1, then decreases from July 1 to Dec 31. So the correct description is that the temperature increases during the first half of the year (from early winter/late winter to summer) and then decreases during the second half (from summer to winter). So option B is correct.

Snap & solve any problem in the app
Get step-by-step solutions on Sovi AI
Photo-based solutions with guided steps
Explore more problems and detailed explanations
Part (a)
- Independent variable: Time (days of the year)
- Dependent variable: Average daily high temperature
- Domain: The set of days in a year, typically \([1, 365]\) (days 1 to 365 representing Jan 1 to Dec 31)
- Range: The set of average daily high temperatures, approximately \([38, 86]\) (in \(^\circ\text{F}\))
Part (b)
(Graph description as above: X - axis: days (1 to 365, labeled with key dates), Y - axis: temperature (\(^\circ\text{F}\)), plot points for each date - temperature pair and connect with a line.)
Part (c)
B. The temperature increases during the first half of the year and then decreases during the second half of the year.