QUESTION IMAGE
Question
datafile: bigbangtheory
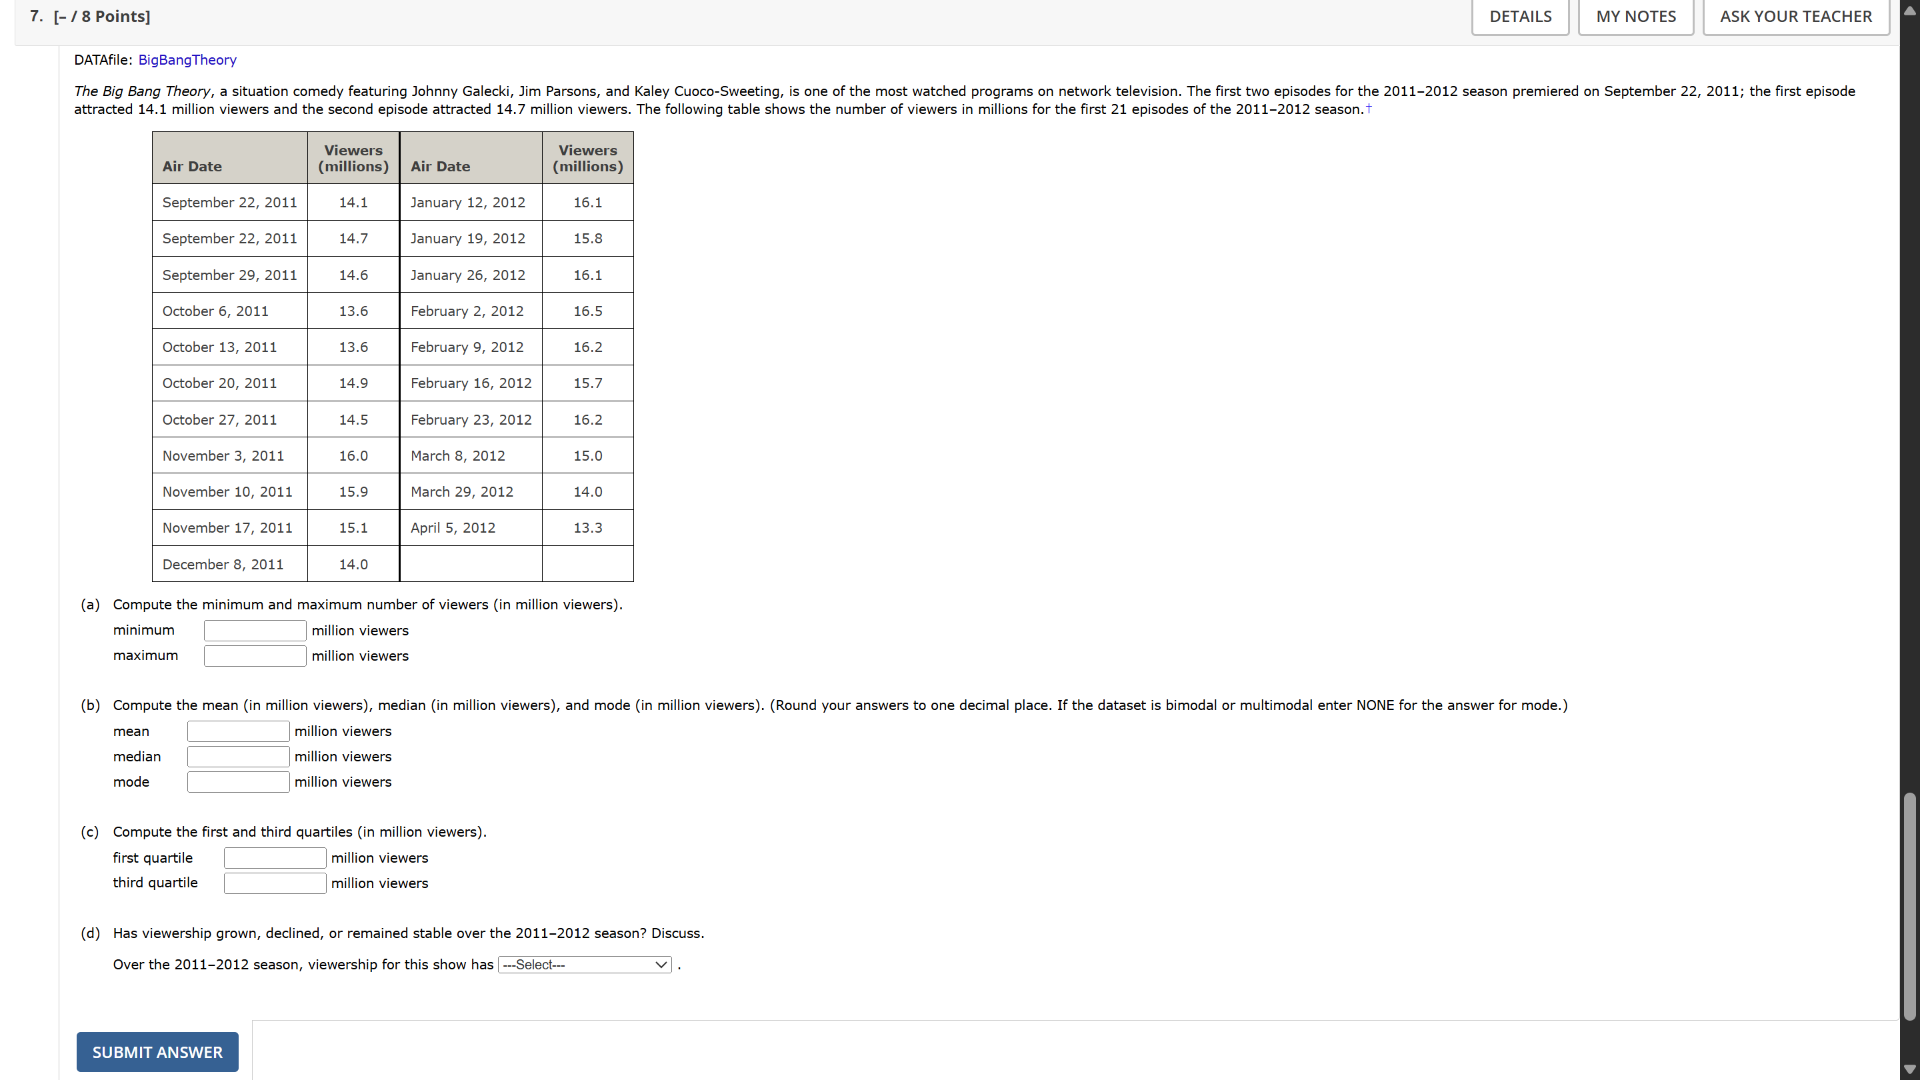
the big bang theory, a situation comedy featuring johnny galecki, jim parsons, and kaley cuoco - sweeting, is one of the most watched programs on network television. the first two episodes for the 2011 - 2012 season premiered on september 22, 2011; the first episode attracted 14.1 million viewers and the second episode attracted 14.7 million viewers. the following table shows the number of viewers in millions for the first 21 episodes of the 2011 - 2012 season.
| air date | viewers (millions) | air date | viewers (millions) |
|---|---|---|---|
| september 22, 2011 | 14.7 | january 19, 2012 | 15.8 |
| september 29, 2011 | 14.6 | january 26, 2012 | 16.1 |
| october 6, 2011 | 13.6 | february 2, 2012 | 16.5 |
| october 13, 2011 | 13.6 | february 9, 2012 | 16.2 |
| october 20, 2011 | 14.9 | february 16, 2012 | 15.7 |
| october 27, 2011 | 14.5 | february 23, 2012 | 16.2 |
| november 3, 2011 | 16.0 | march 8, 2012 | 15.0 |
| november 10, 2011 | 15.9 | march 29, 2012 | 14.0 |
| november 17, 2011 | 15.1 | april 5, 2012 | 13.3 |
| december 8, 2011 | 14.0 |
(a) compute the minimum and maximum number of viewers (in million viewers).
minimum
million viewers
maximum
million viewers
(b) compute the mean (in million viewers), median (in million viewers), and mode (in million viewers). (round your answers to one decimal place. if the dataset is bimodal or multimodal enter none for the answer for mode.)
mean
million viewers
median
million viewers
mode
million viewers
(c) compute the first and third quartiles (in million viewers).
first quartile
million viewers
third quartile
million viewers
(d) has viewership grown, declined, or remained stable over the 2011 - 2012 season? discuss.
over the 2011 - 2012 season, viewership for this show has
Part (a)
Step1: List all viewer values
The viewer values (in millions) are: 14.1, 14.7, 14.6, 13.6, 13.6, 14.9, 14.5, 16.0, 15.9, 15.1, 14.0, 16.1, 15.8, 16.1, 16.5, 16.2, 15.7, 16.2, 15.0, 14.0, 13.3.
Step2: Find minimum
Sort the values and find the smallest. Sorted: 13.3, 13.6, 13.6, 14.0, 14.0, 14.1, 14.5, 14.6, 14.7, 14.9, 15.0, 15.1, 15.7, 15.8, 15.9, 16.0, 16.1, 16.1, 16.2, 16.2, 16.5. The minimum is 13.3.
Step3: Find maximum
From the sorted list, the largest value is 16.5.
Step1: Compute mean
Sum all values: \(14.1 + 14.7 + 14.6 + 13.6 + 13.6 + 14.9 + 14.5 + 16.0 + 15.9 + 15.1 + 14.0 + 16.1 + 15.8 + 16.1 + 16.5 + 16.2 + 15.7 + 16.2 + 15.0 + 14.0 + 13.3\)
Sum \(= 319.7\). Number of values \(n = 21\). Mean \(= \frac{319.7}{21} \approx 15.2\) (rounded to one decimal).
Step2: Compute median
For \(n = 21\) (odd), median is the 11th value in sorted list. Sorted list (21 values), 11th value: 15.0? Wait, no, re - check sorted list:
Wait, let's re - sort properly:
13.3, 13.6, 13.6, 14.0, 14.0, 14.1, 14.5, 14.6, 14.7, 14.9, 15.0, 15.1, 15.7, 15.8, 15.9, 16.0, 16.1, 16.1, 16.2, 16.2, 16.5.
Wait, the 11th value (since \(n = 21\), position \(\frac{n + 1}{2}=11\)) is 15.0? Wait no, count again:
1:13.3, 2:13.6, 3:13.6, 4:14.0, 5:14.0, 6:14.1, 7:14.5, 8:14.6, 9:14.7, 10:14.9, 11:15.0, 12:15.1, 13:15.7, 14:15.8, 15:15.9, 16:16.0, 17:16.1, 18:16.1, 19:16.2, 20:16.2, 21:16.5. So median is 15.0? Wait no, wait I made a mistake in counting. Wait, the 11th term: let's list the indices from 1 to 21. The middle term is at index 11. So the 11th term is 15.0? Wait, no, wait the values:
Wait, after 14.9 (10th term), the 11th term is 15.0? Wait, no, let's re - list the sorted data with correct indexing:
1: 13.3
2: 13.6
3: 13.6
4: 14.0
5: 14.0
6: 14.1
7: 14.5
8: 14.6
9: 14.7
10: 14.9
11: 15.0
12: 15.1
13: 15.7
14: 15.8
15: 15.9
16: 16.0
17: 16.1
18: 16.1
19: 16.2
20: 16.2
21: 16.5
Yes, median is 15.0? Wait, no, wait the sum was 319.7, and \(319.7\div21\approx15.223\), rounded to one decimal is 15.2.
Step3: Compute mode
Find the most frequent value. 13.6 (2 times), 14.0 (2 times), 16.1 (2 times), 16.2 (2 times). Since multiple values have frequency 2, the dataset is multimodal, so mode is NONE.
Step1: Find first quartile (\(Q_1\))
For \(n = 21\), the position of \(Q_1\) is \(\frac{n + 1}{4}=5.5\) (since \(n+1 = 22\), \(22\div4 = 5.5\)). The 5th and 6th values in the sorted list: 5th:14.0, 6th:14.1. \(Q_1=\frac{14.0 + 14.1}{2}=14.05\approx14.1\) (rounded? Wait, no, let's use the method for odd \(n\). The lower half: first 10 values (since \(n = 21\), lower half is first 10, upper half is last 10, middle is 11th). Wait, another method: for \(n = 21\), the index for \(Q_1\) is \(\lfloor\frac{n}{4}
floor + 1=\lfloor5.25
floor+1 = 6\)? Wait, maybe better to use the sorted list. The first quartile is the median of the lower half. Lower half: first 10 values (13.3, 13.6, 13.6, 14.0, 14.0, 14.1, 14.5, 14.6, 14.7, 14.9). The median of these 10 (even number) is average of 5th and 6th: 5th:14.0, 6th:14.1. \(Q_1=\frac{14.0 + 14.1}{2}=14.05\approx14.1\) (or 14.05, but let's check).
Step2: Find third quartile (\(Q_3\))
Third quartile is the median of the upper half. Upper half: last 10 values (15.1, 15.7, 15.8, 15.9, 16.0, 16.1, 16.1, 16.2, 16.2, 16.5). Median of these 10: 5th:16.0, 6th:16.1. \(Q_3=\frac{16.0 + 16.1}{2}=16.05\approx16.1\) (or 16.05). Wait, but let's check the sorted list again. Wait, the middle term is 11th (15.0). The lower half is first 10 (indices 1 - 10), upper half is indices 12 - 21 (10 values). So for lower half (1 - 10): values 13.3,13.6,13.6,14.0,14.0,14.1,14.5,14.6,14.7,14.9. Median of lower half: (14.0 + 14.1)/2 = 14.05. For upper half (12 - 21):15.1,15.7,15.8,15.9,16.0,16.1,16.1,16.2,16.2,16.5. Median: (16.0 + 16.1)/2 = 16.05.

Snap & solve any problem in the app
Get step-by-step solutions on Sovi AI
Photo-based solutions with guided steps
Explore more problems and detailed explanations
minimum: 13.3 million viewers
maximum: 16.5 million viewers