QUESTION IMAGE
Question
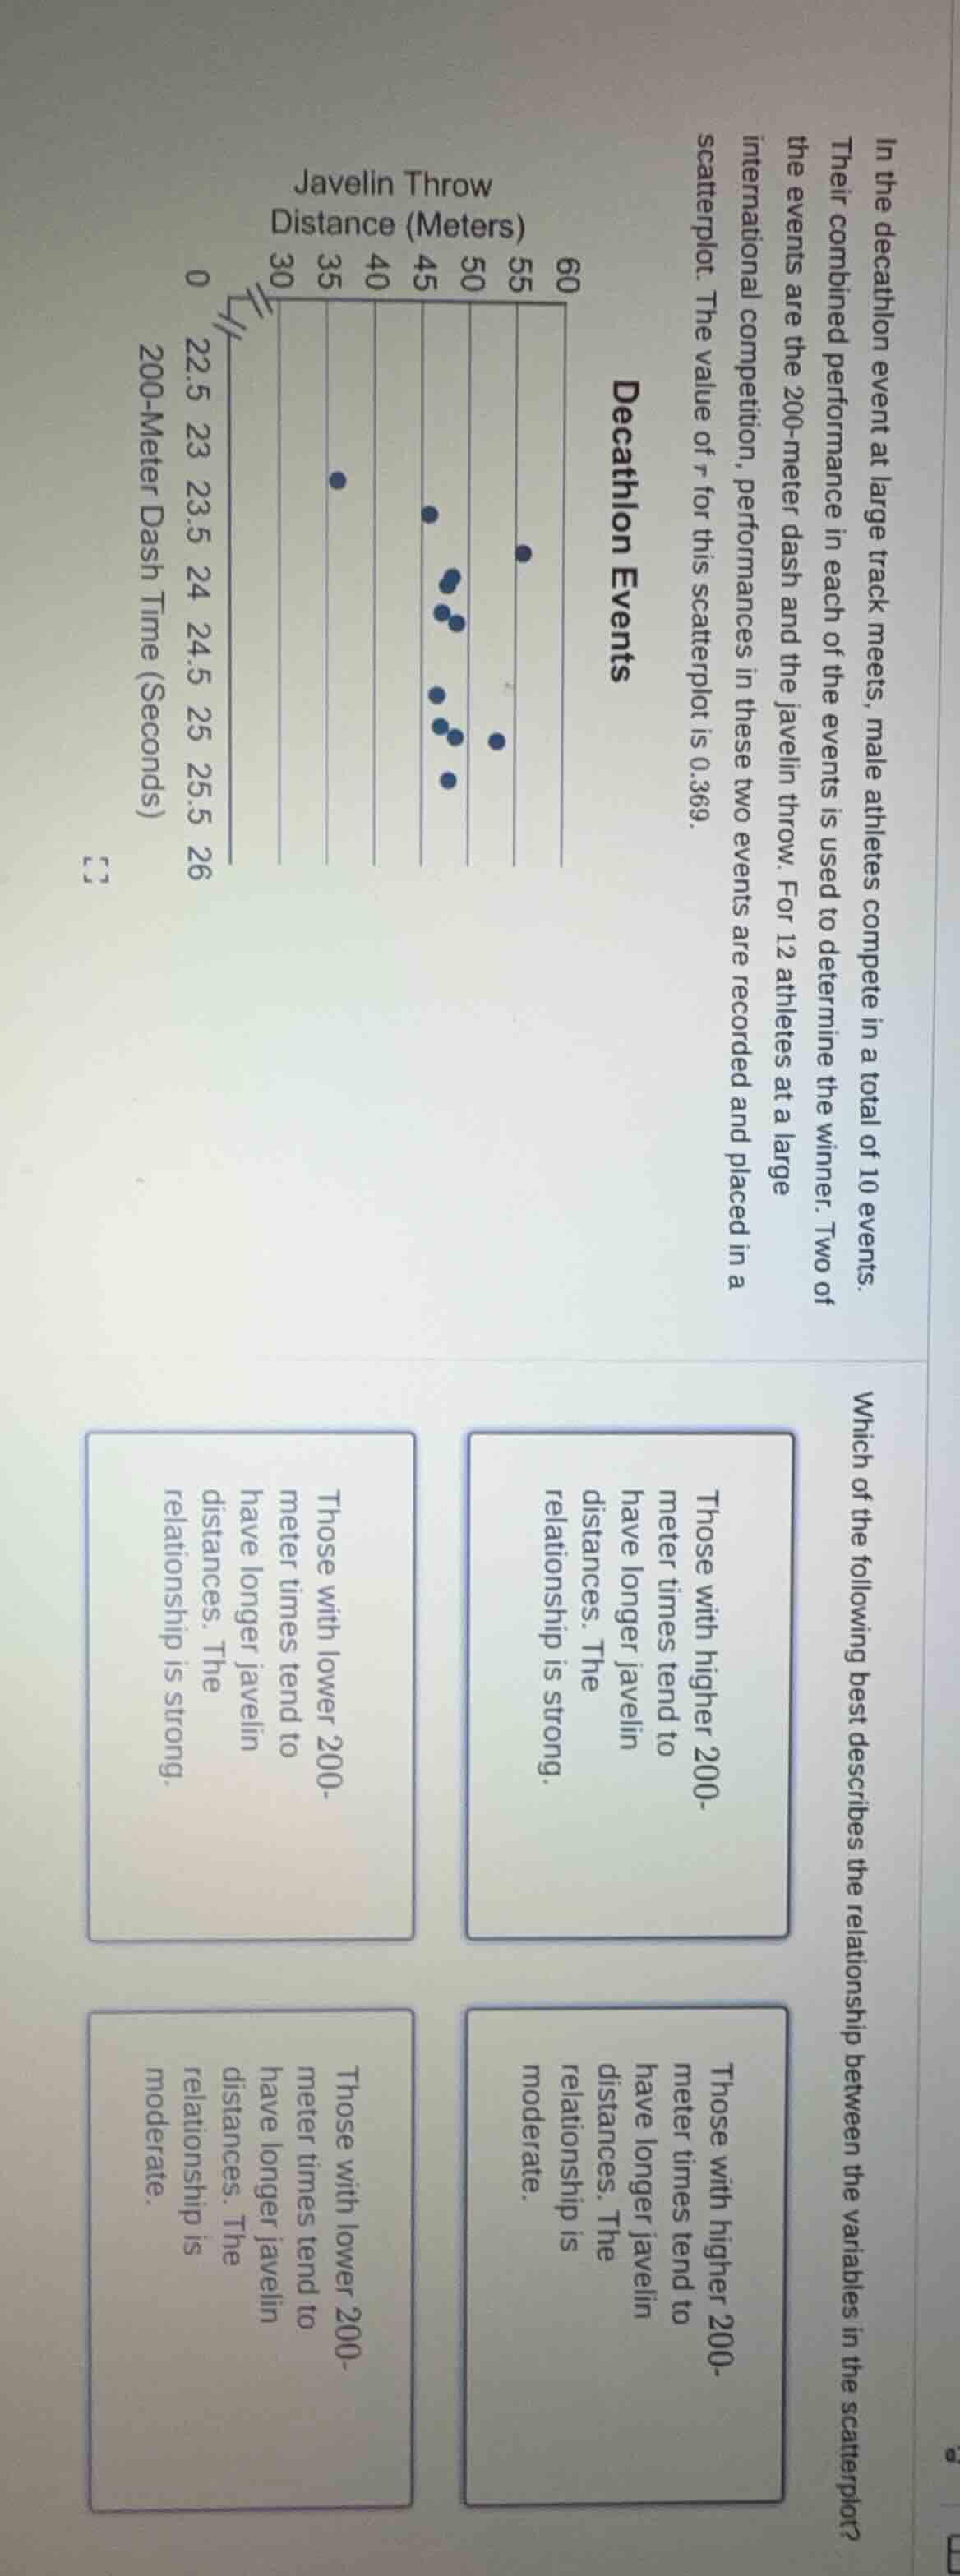
in the decathlon event at large track meets, male athletes compete in a total of 10 events. their combined performance in each of the events is used to determine the winner. two of the events are the 200 - meter dash and the javelin throw. for 12 athletes at a large international competition, performances in these two events are recorded and placed in a scatterplot. the value of ( r ) for this scatterplot is 0.369.
which of the following best describes the relationship between the variables in the scatterplot?
- those with higher 200 - meter times tend to have longer javelin distances. the relationship is strong.
- those with lower 200 - meter times tend to have longer javelin distances. the relationship is strong.
- those with higher 200 - meter times tend to have longer javelin distances. the relationship is moderate.
- those with lower 200 - meter times tend to have longer javelin distances. the relationship is moderate.
- First, analyze the direction of the relationship: In the scatterplot, as the 200-meter dash time (x-axis) increases (higher times), the javelin throw distance (y-axis) tends to decrease. This means lower (faster) 200-meter times correspond to longer javelin distances.
- Then, evaluate the strength: The correlation coefficient $r = 0.369$. Values of $r$ between 0.3 and 0.7 indicate a moderate linear relationship.
- Match with the options: The only option that correctly identifies both the direction (lower 200-meter times relate to longer javelin distances) and the moderate strength is the bottom-left choice.

Snap & solve any problem in the app
Get step-by-step solutions on Sovi AI
Photo-based solutions with guided steps
Explore more problems and detailed explanations
Those with lower 200-meter times tend to have longer javelin distances. The relationship is moderate.