QUESTION IMAGE
Question
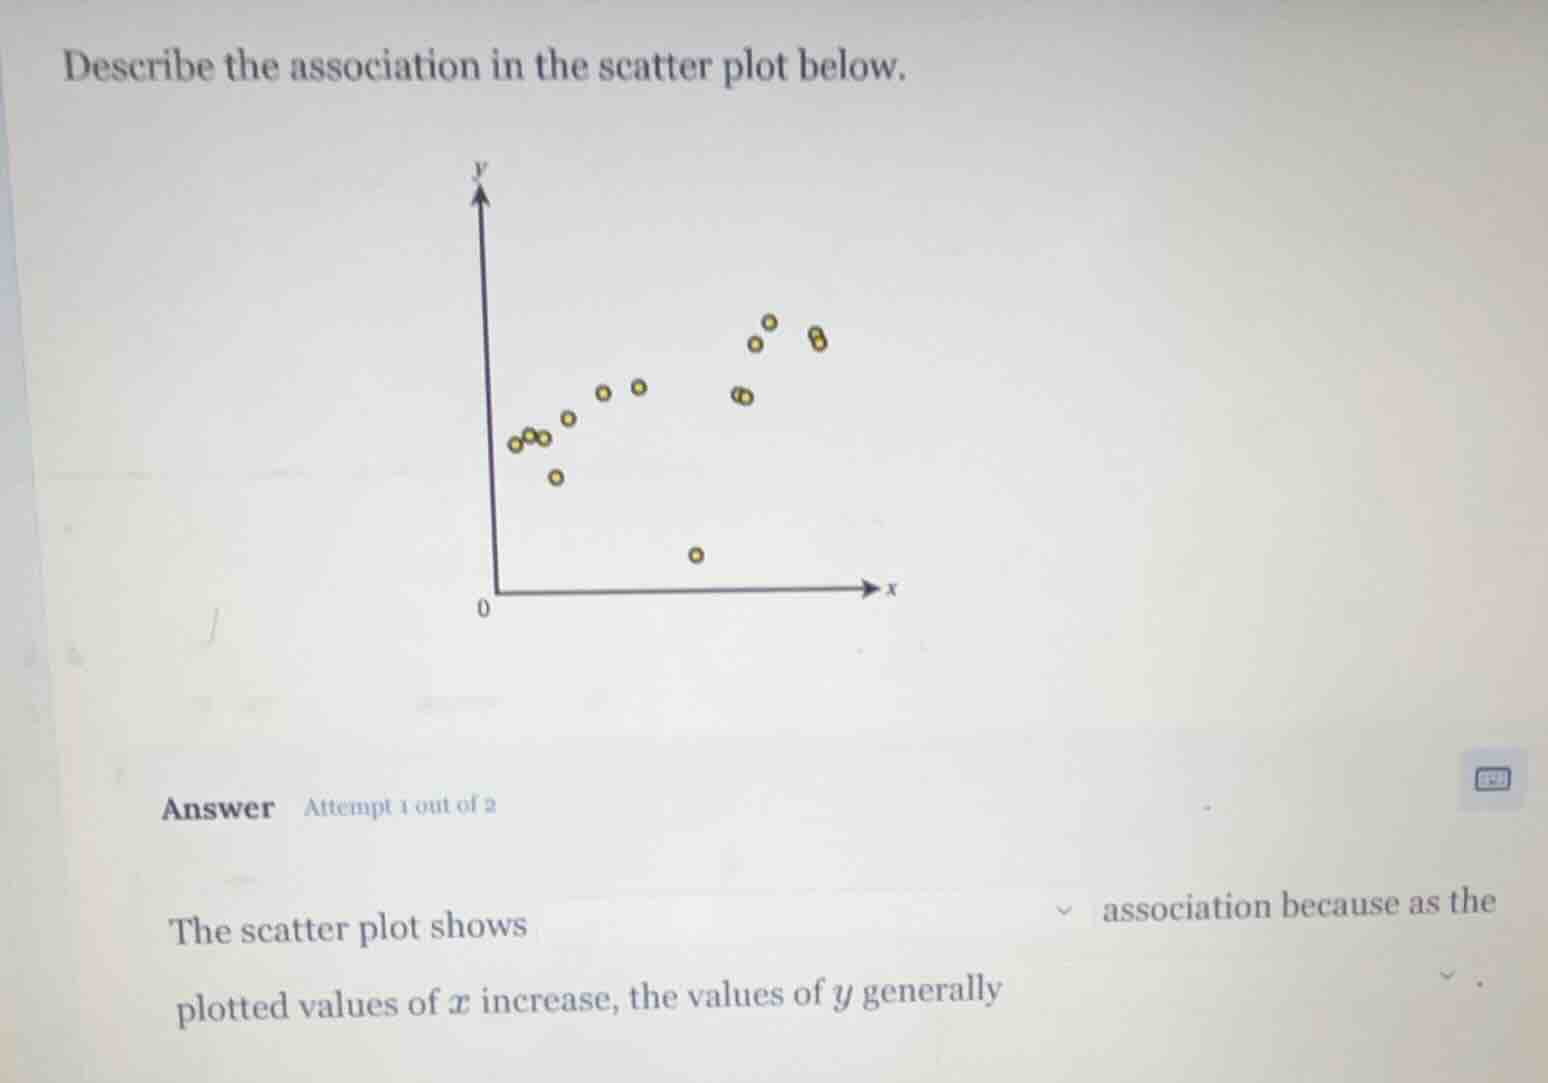
describe the association in the scatter plot below.
answer attempt 1 out of 2
the scatter plot shows association because as the
plotted values of $x$ increase, the values of $y$ generally .
A scatter plot's association is described by direction and strength. Here, as x-values rise, most y-values rise, with one outlier that does not override the overall trend. This is a positive, moderately strong association.

Snap & solve any problem in the app
Get step-by-step solutions on Sovi AI
Photo-based solutions with guided steps
Explore more problems and detailed explanations
The scatter plot shows a positive, moderately strong association because as the plotted values of $x$ increase, the values of $y$ generally increase (with one outlier that does not change the overall trend).