QUESTION IMAGE
Question
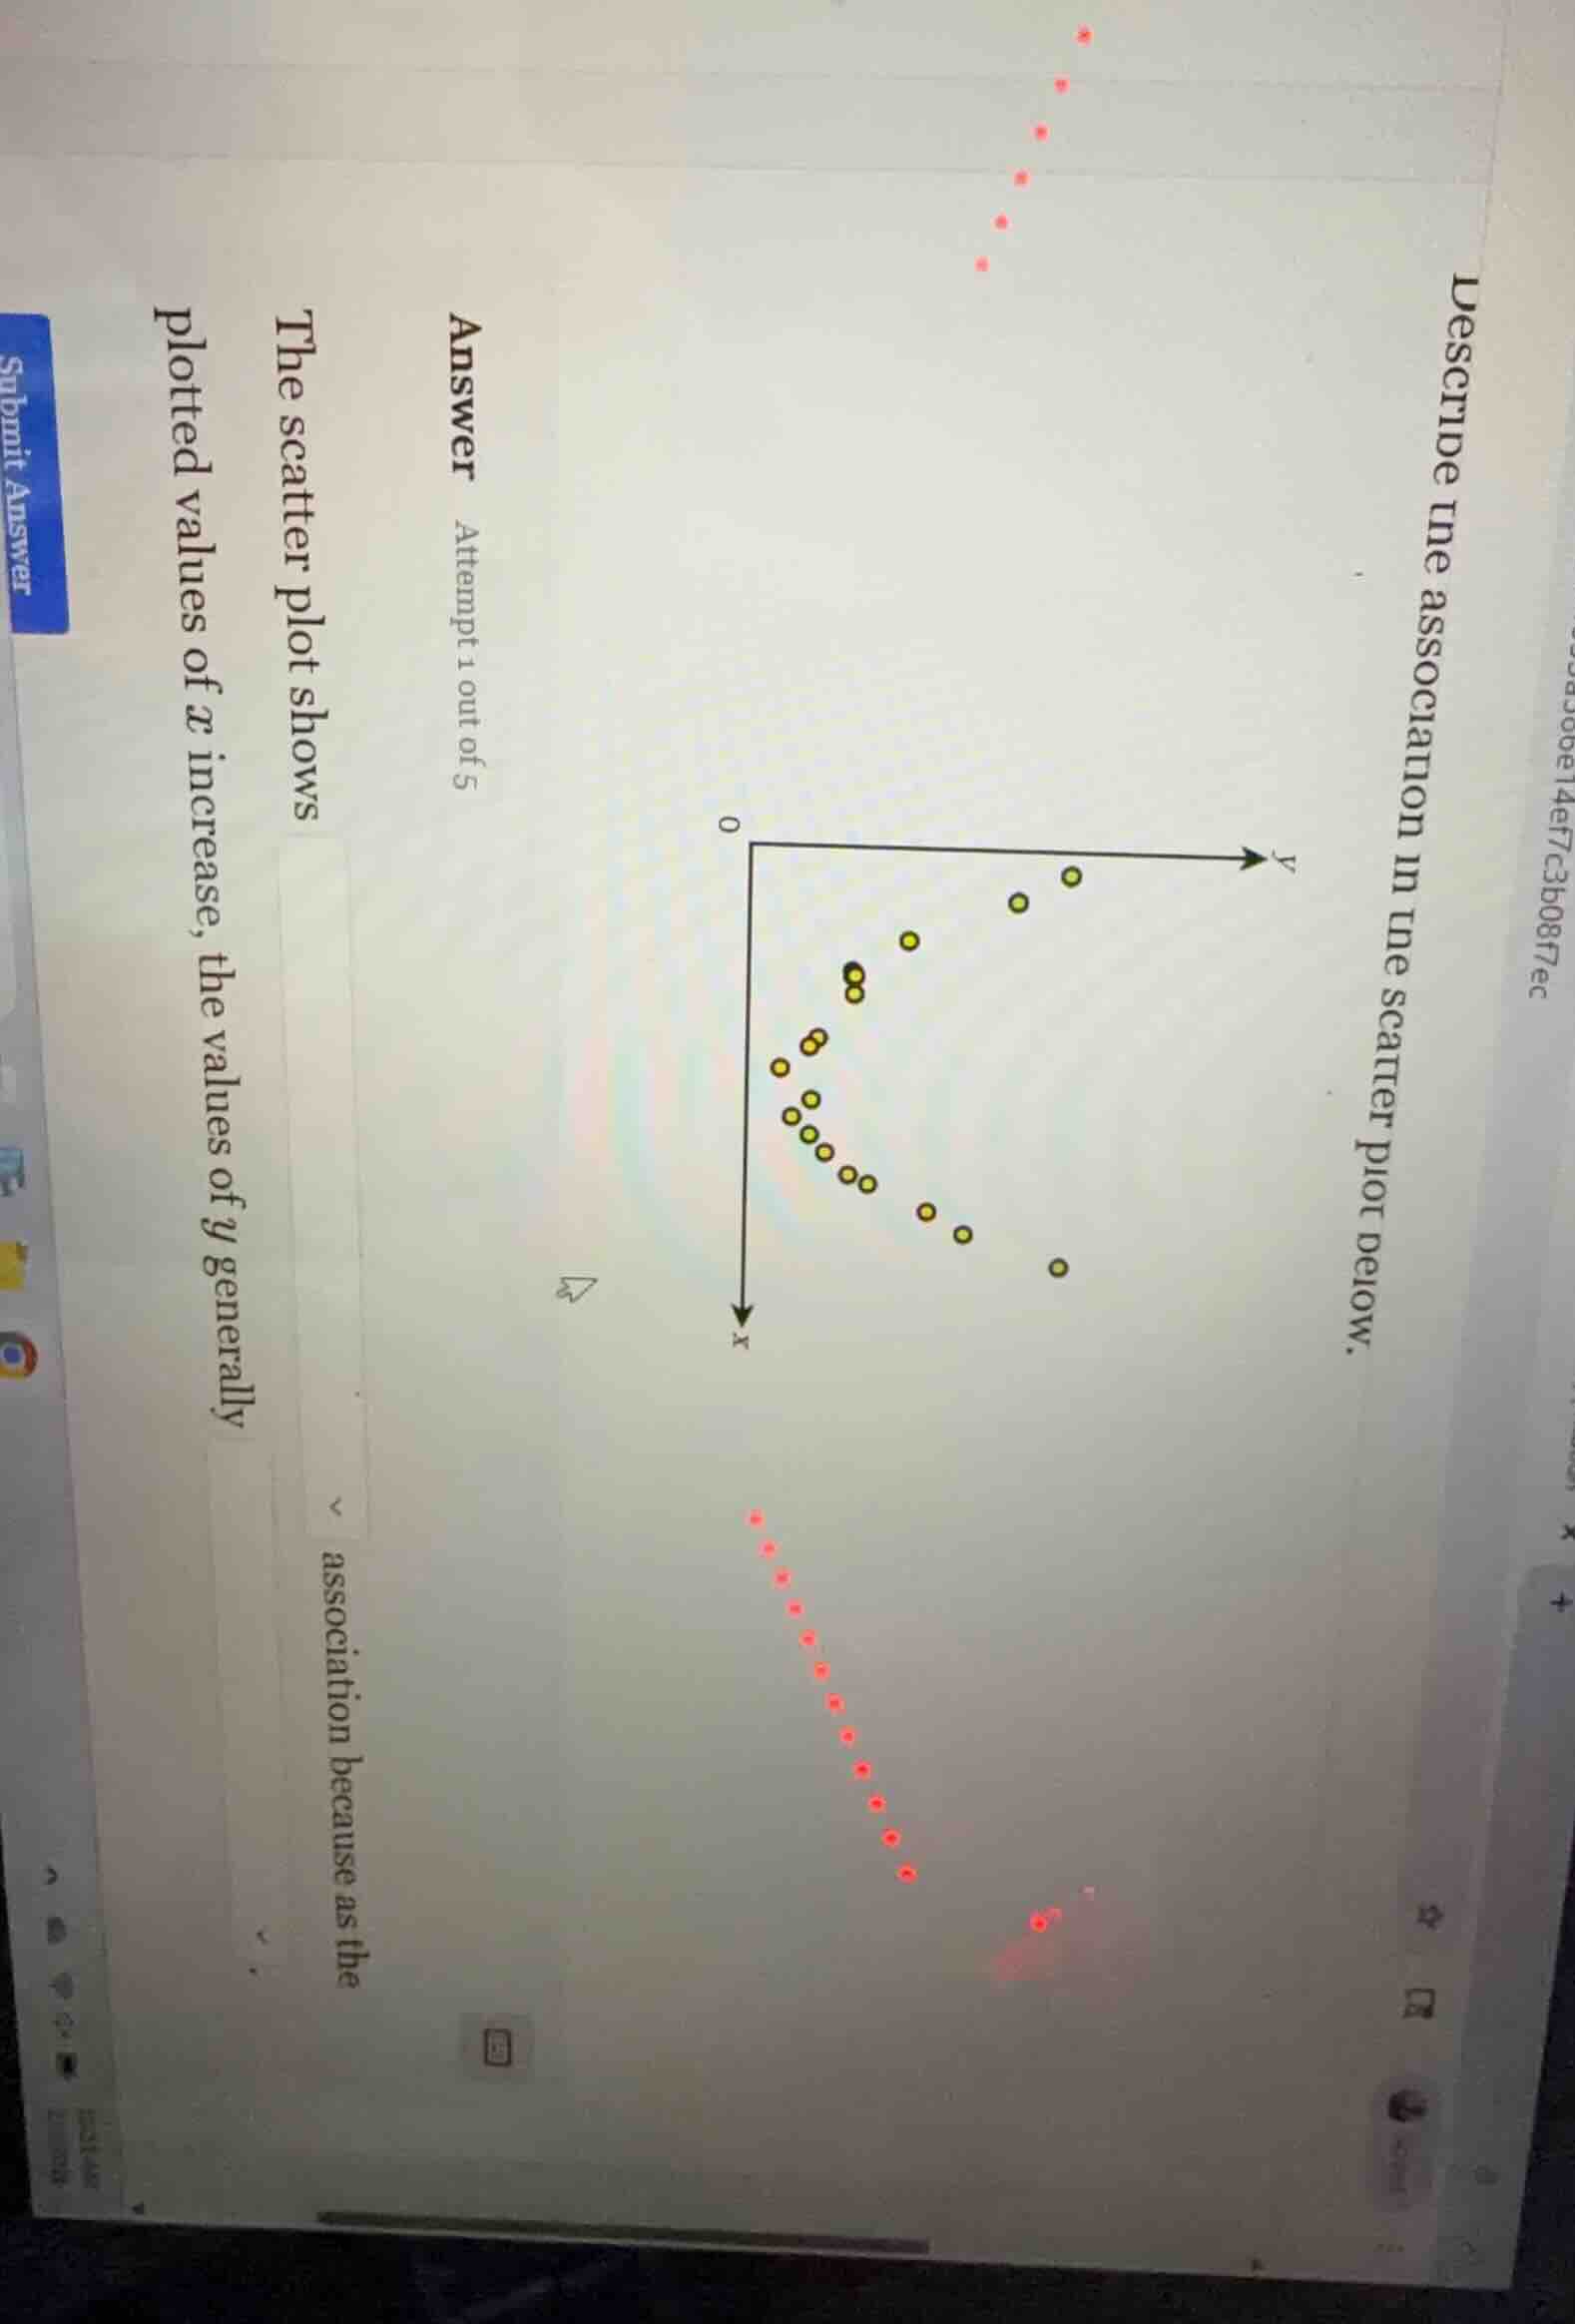
describe the association in the scatter plot below.
answer attempt 1 out of 5
the scatter plot shows
association because as the
plotted values of x increase, the values of y generally
To determine the association, we analyze the scatter plot. The yellow points form a curve: as \( x \) increases, \( y \) first decreases, reaches a minimum, then increases. This is a non - linear (curved) association. The direction changes, so it's not linear (positive/negative). The pattern is a curve, so the association is non - linear (or curved). Also, as \( x \) increases, \( y \) has a U - shaped (or curved) relationship: first decreases, then increases.

Snap & solve any problem in the app
Get step-by-step solutions on Sovi AI
Photo-based solutions with guided steps
Explore more problems and detailed explanations
The scatter plot shows a non - linear (curved) association because as the plotted values of \( x \) increase, the values of \( y \) generally first decrease and then increase (forming a curved pattern).