QUESTION IMAGE
Question
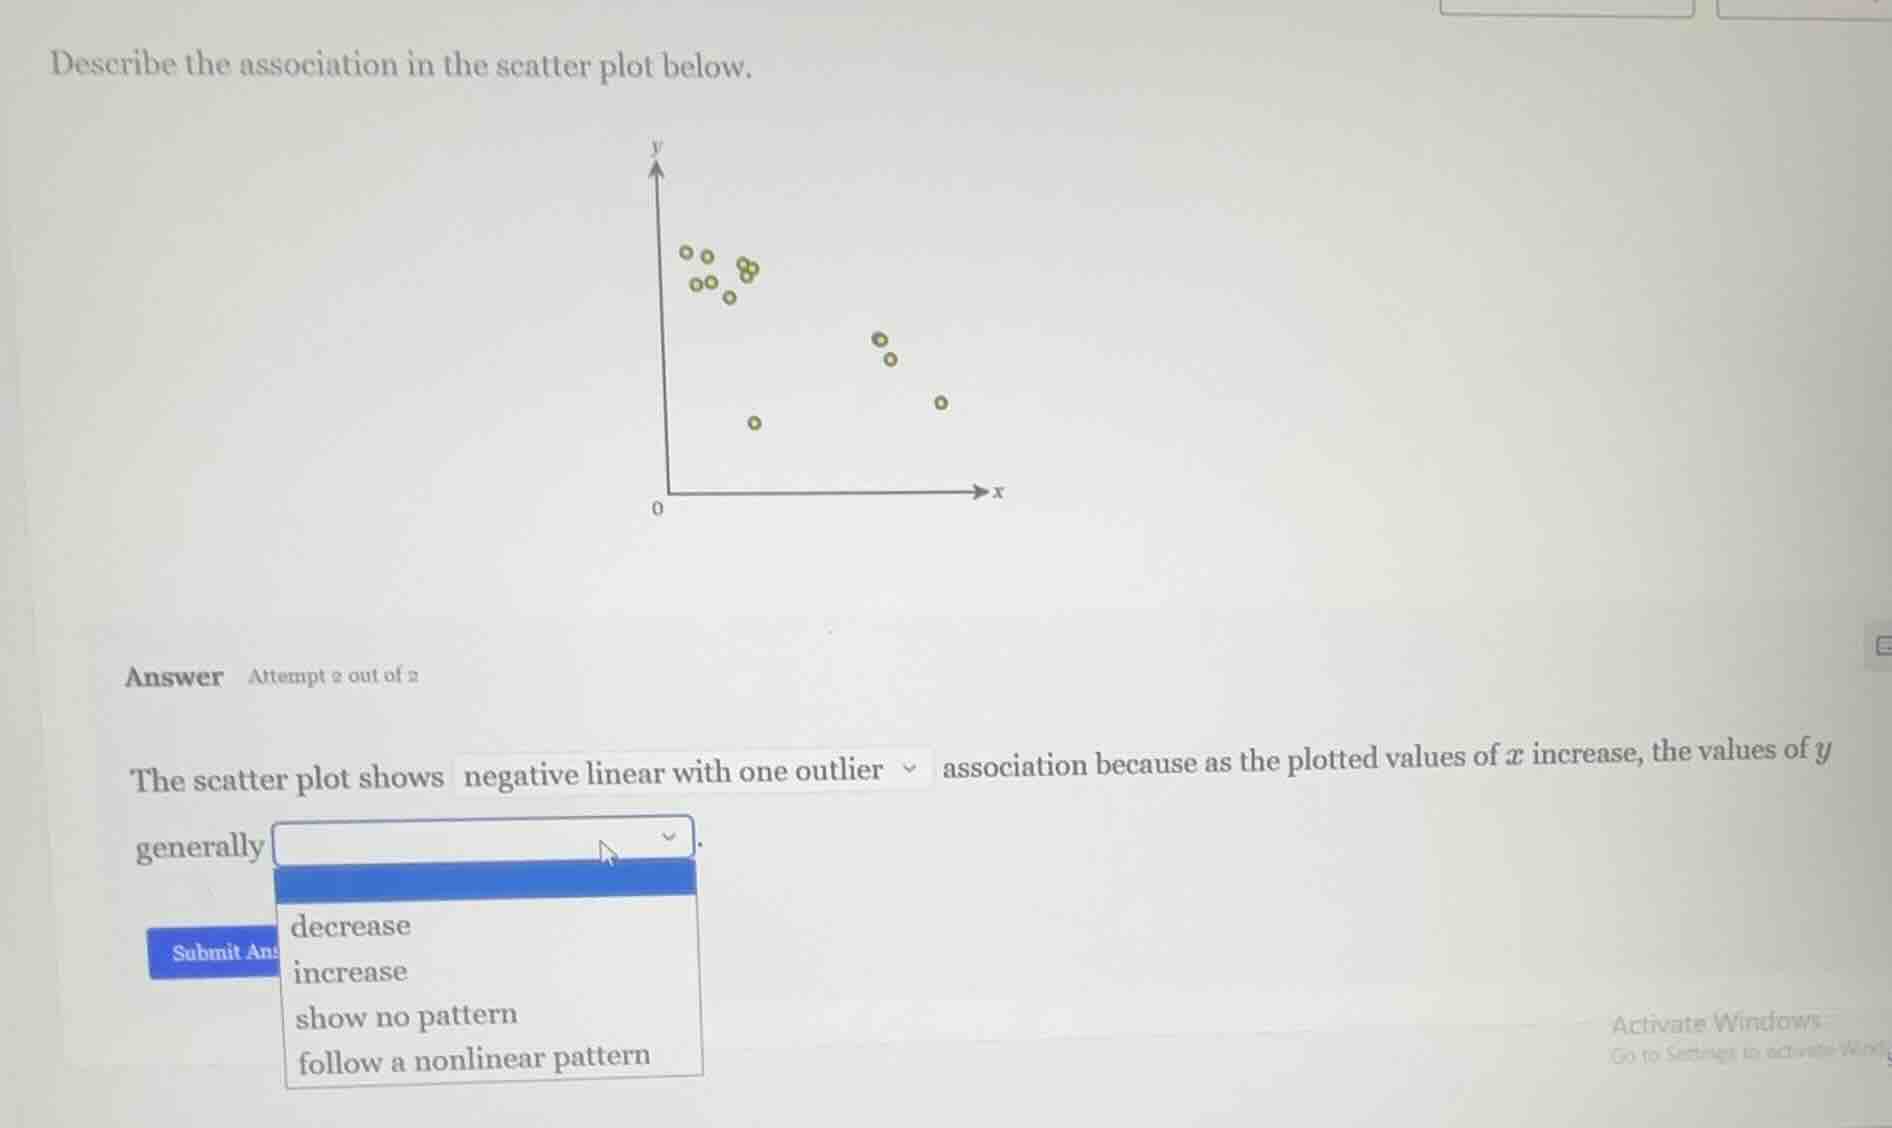
describe the association in the scatter plot below.
answer attempt 2 out of 2
the scatter plot shows negative linear with one outlier association because as the plotted values of ( x ) increase, the values of ( y ) generally
options: decrease, increase, show no pattern, follow a nonlinear pattern
Brief Explanations
A negative linear association means that as the x-values increase, the y-values tend to decrease. The scatter plot has a downward trend overall (with one outlier), so y values go down as x goes up.

Snap & solve any problem in the app
Get step-by-step solutions on Sovi AI
Photo-based solutions with guided steps
Explore more problems and detailed explanations
decrease