QUESTION IMAGE
Question
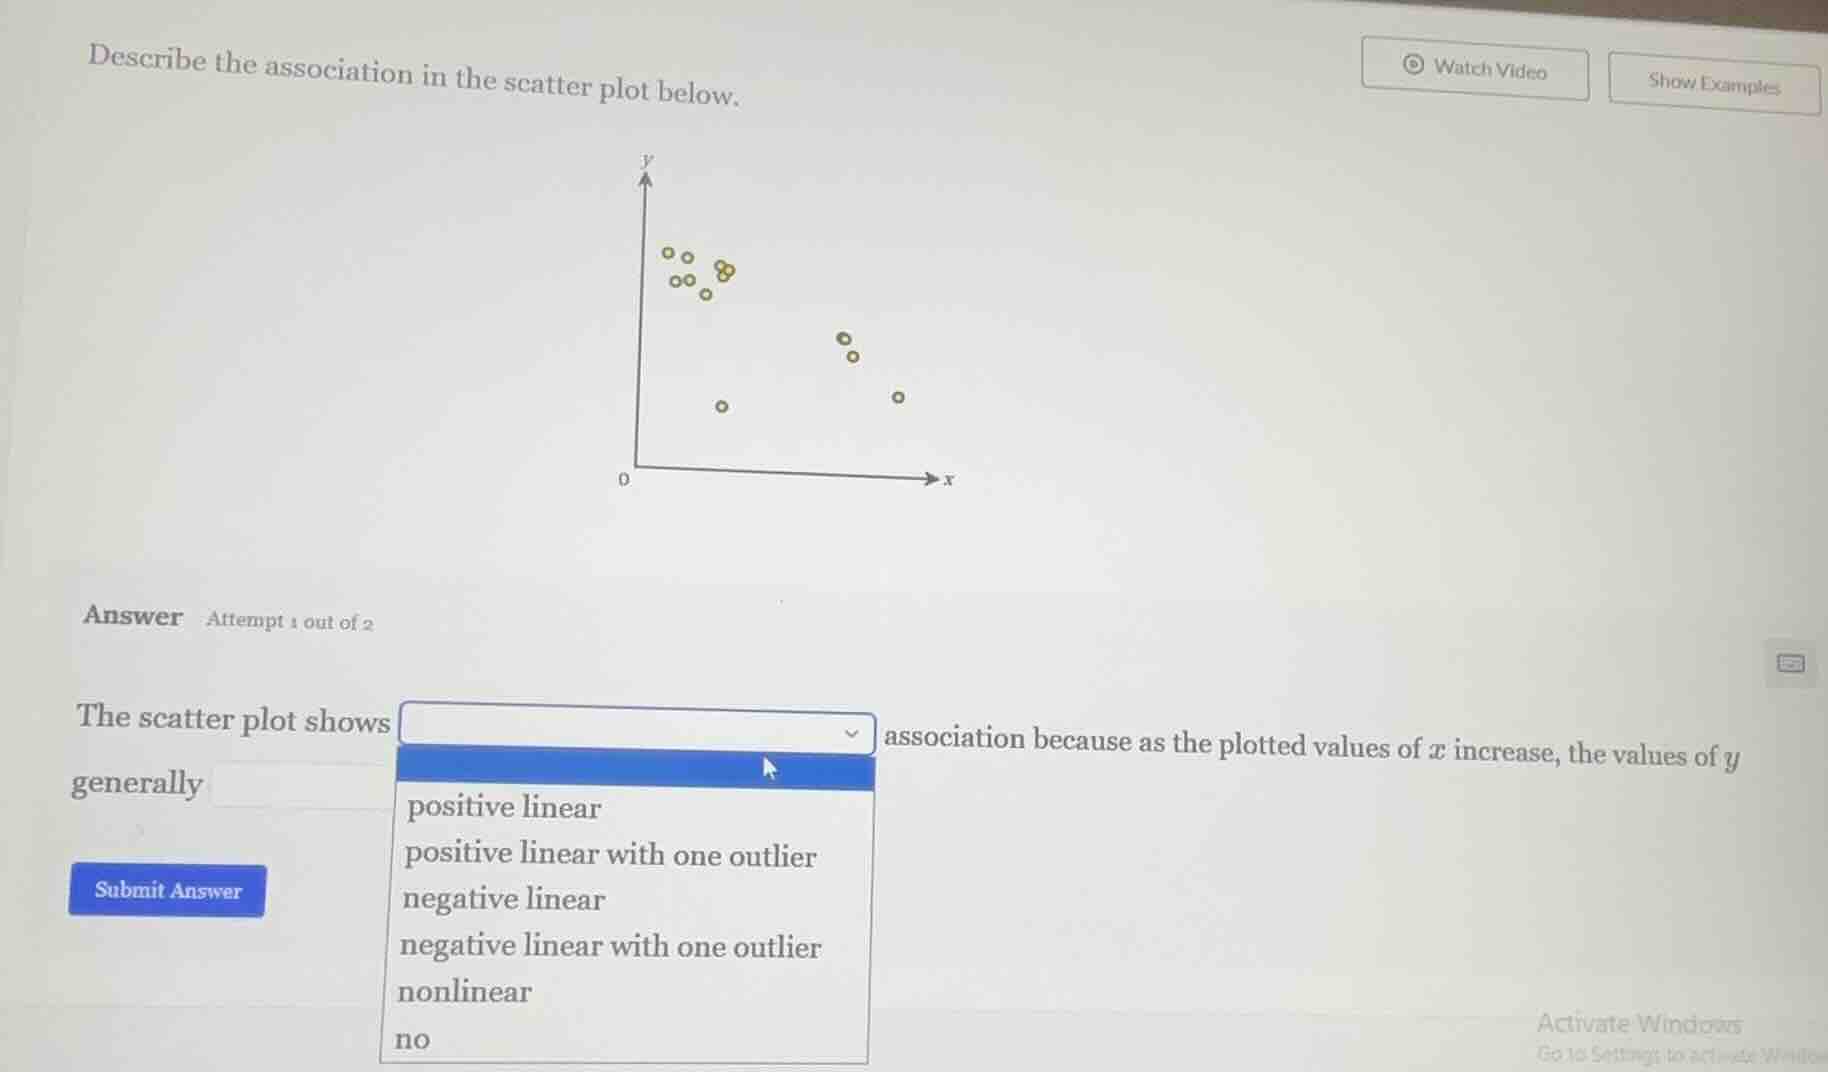
describe the association in the scatter plot below. answer attempt 1 out of 2 the scatter plot shows dropdown association because as the plotted values of ( x ) increase, the values of ( y ) generally blank. the dropdown options are: positive linear, positive linear with one outlier, negative linear, negative linear with one outlier, nonlinear, no
Brief Explanations
- First, observe the trend: as $x$ increases, $y$ generally decreases, which is a negative association.
- The points follow a roughly straight pattern, so it is linear.
- There is one point far from the main cluster of points that follow the linear trend, which is an outlier.

Snap & solve any problem in the app
Get step-by-step solutions on Sovi AI
Photo-based solutions with guided steps
Explore more problems and detailed explanations
negative linear with one outlier