QUESTION IMAGE
Question
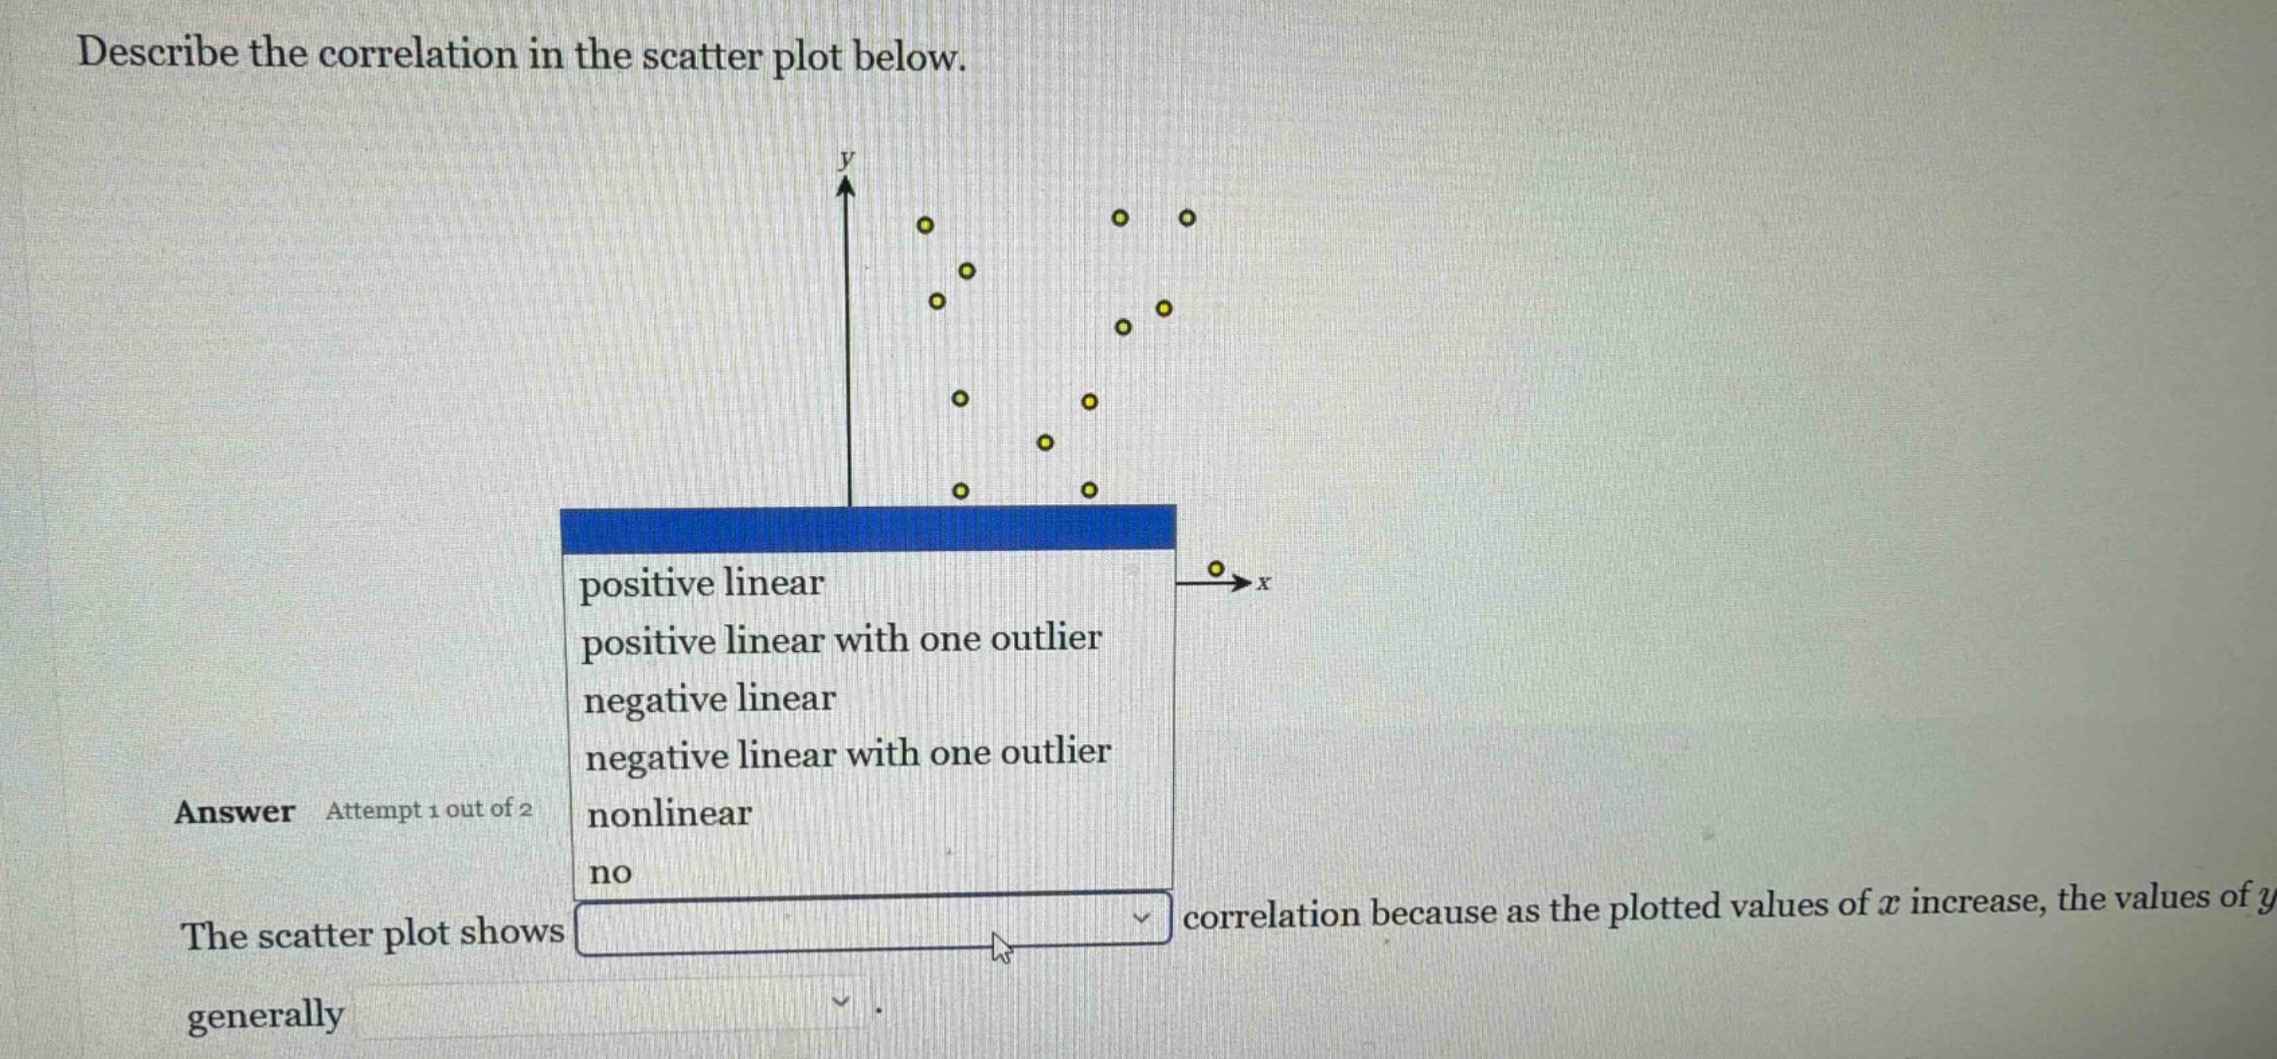
describe the correlation in the scatter plot below.
answer attempt 1 out of 2
the scatter plot shows
positive linear
positive linear with one outlier
negative linear
negative linear with one outlier
nonlinear
no
correlation because as the plotted values of ( x ) increase, the values of ( y ) generally .
To determine the correlation, we analyze the scatter plot. First, check if there's a linear trend: the points don't form a clear positive or negative linear pattern. Also, there's an outlier (the point far to the right on the x - axis). But overall, the points are scattered randomly, so there's no correlation. When x increases, y doesn't show a consistent increase or decrease.

Snap & solve any problem in the app
Get step-by-step solutions on Sovi AI
Photo-based solutions with guided steps
Explore more problems and detailed explanations
The scatter plot shows no correlation because as the plotted values of \( x \) increase, the values of \( y \) generally do not follow a consistent pattern (increase or decrease in a linear way). The first dropdown should be "no" and for the second part (about the trend of \( y \) as \( x \) increases), since there's no correlation, \( y \) doesn't have a consistent upward or downward trend (but based on the options and the scatter plot's randomness, the key is the "no" correlation first). So the first answer (for the correlation type) is "no".