QUESTION IMAGE
Question
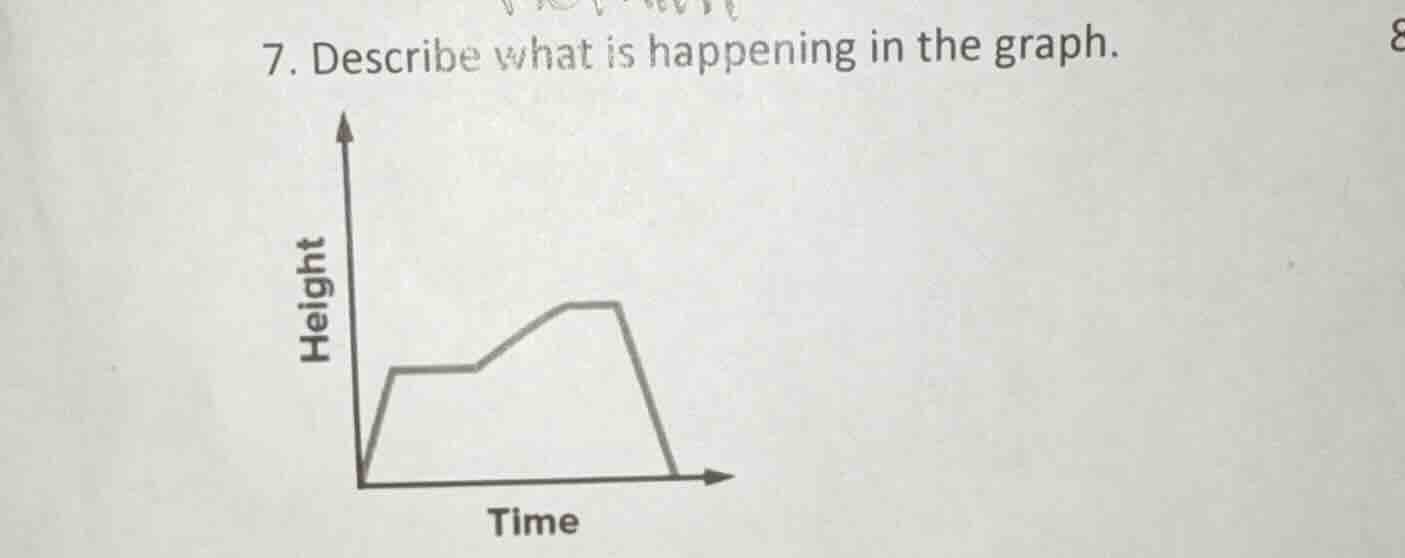
- describe what is happening in the graph.
height
time
The graph has height on the y - axis and time on the x - axis. Initially, height increases rapidly (maybe an object moving up quickly), then stays constant (object at a constant height, like pausing), then increases again (object moving up further), then stays constant (another pause), and finally decreases rapidly to zero (object falling down to the starting height, like landing).

Snap & solve any problem in the app
Get step-by-step solutions on Sovi AI
Photo-based solutions with guided steps
Explore more problems and detailed explanations
The graph shows a change in height over time: height first increases rapidly, then remains constant, then increases again, then remains constant, and finally decreases rapidly to zero. This could represent, for example, the motion of an object (like a vehicle or a person moving up, pausing, moving up more, pausing, and then descending) where height is related to the object's vertical position and time is the progression of the event.