QUESTION IMAGE
Question
descriptive statistics
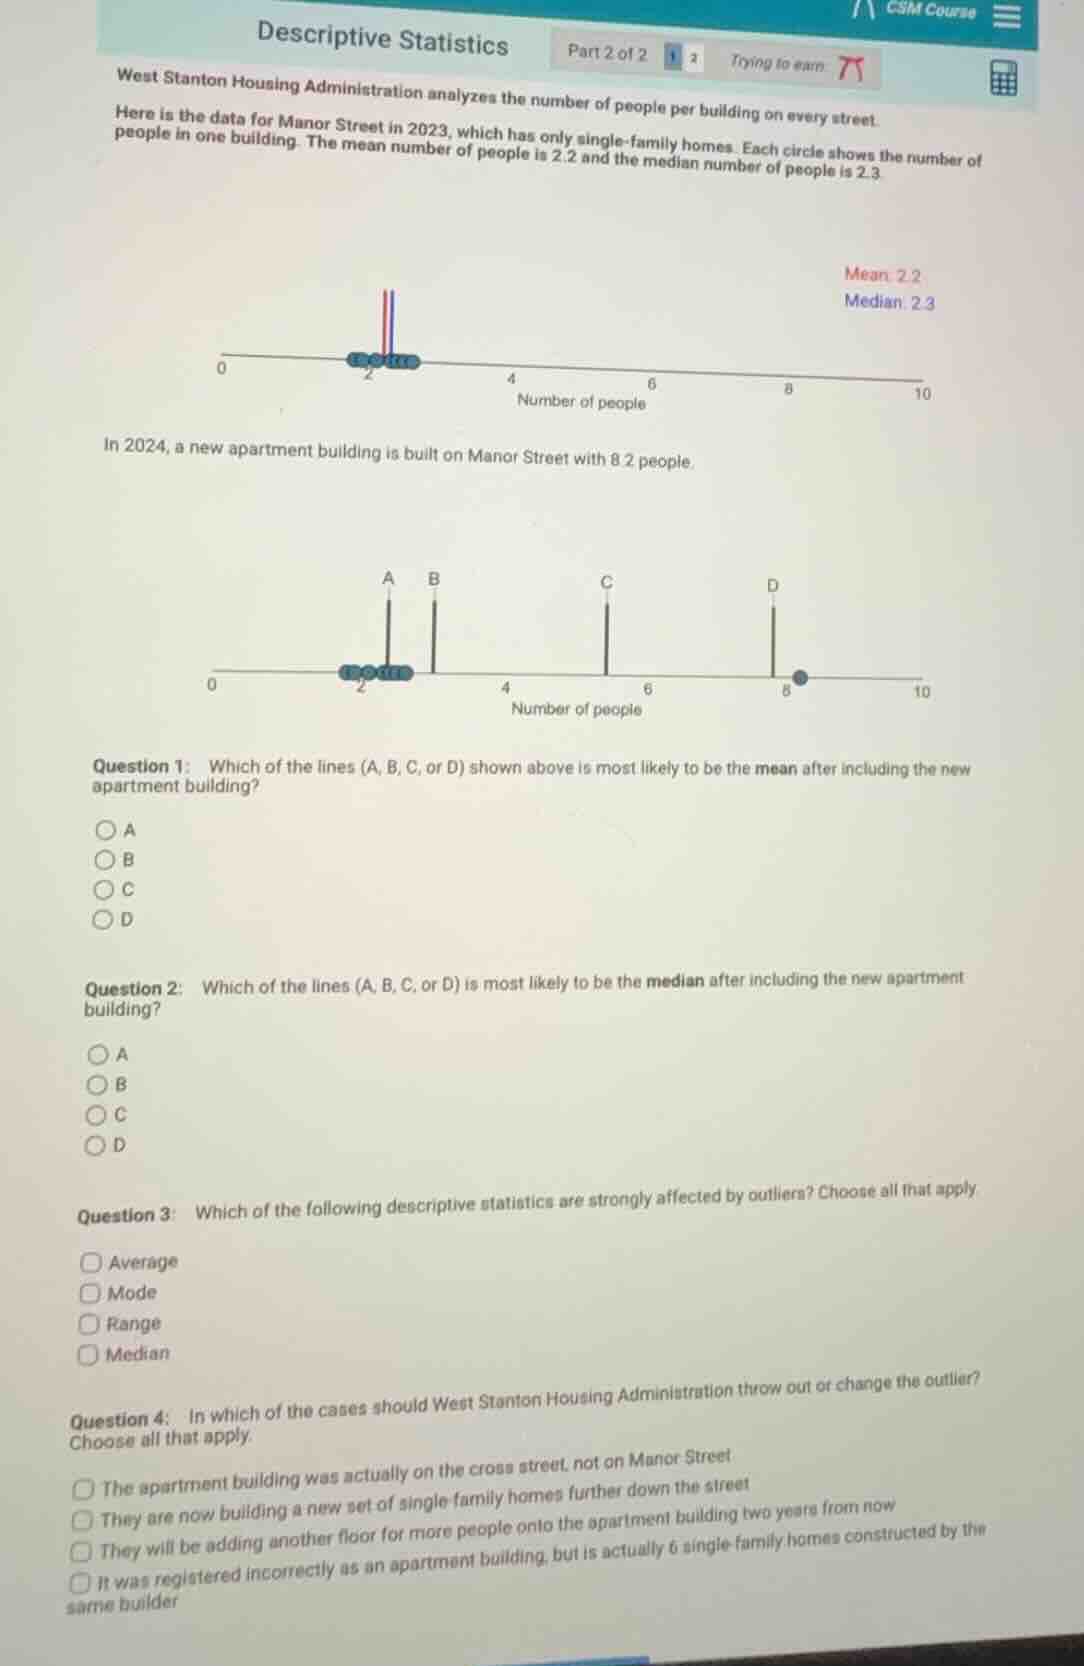
west stanton housing administration analyzes the number of people per building on every street.
here is the data for manor street in 2023, which has only single - family homes. each circle shows the number of people in one building. the mean number of people is 2.2 and the median number of people is 2.3.
in 2024, a new apartment building is built on manor street with 8.2 people.
question 1: which of the lines (a, b, c, or d) shown above is most likely to be the mean after including the new apartment building?
a
b
c
d
question 2: which of the lines (a, b, c, or d) is most likely to be the median after including the new apartment building?
a
b
c
d
question 3: which of the following descriptive statistics are strongly affected by outliers? choose all that apply
average
mode
range
median
question 4: in which of the cases should west stanton housing administration throw out or change the outlier? choose all that apply.
the apartment building was actually on the cross street, not on manor street
they are now building a new set of single family homes further down the street
they will be adding another floor for more people onto the apartment building two years from now
it was registered incorrectly as an apartment building, but is actually 6 single - family homes constructed by the same builder
Step1: Analyze mean shift with outlier
The mean is pulled toward outliers. Original mean = 2.2, new value = 8.2 (far higher). The new mean will increase noticeably but not jump all the way to 8.2, so it aligns with line C.
Step2: Analyze median shift with outlier
The median is resistant to outliers. Original median = 2.3. Adding one high value will not change the median much, so it stays near the original median, aligning with line B.
Step3: Identify stats affected by outliers
Mean (average) and range depend on extreme values; mode/median do not.
Step4: Identify valid outlier adjustments
Outliers are only adjusted if data is misclassified or misrecorded, not for future changes or unrelated new construction.

Snap & solve any problem in the app
Get step-by-step solutions on Sovi AI
Photo-based solutions with guided steps
Explore more problems and detailed explanations
Question 1: C
Question 2: B
Question 3: Average, Range
Question 4: The apartment building was actually on the cross street, not on Manor Street; It was registered incorrectly as an apartment building, but is actually 6 single-family homes constructed by the same builder