QUESTION IMAGE
Question
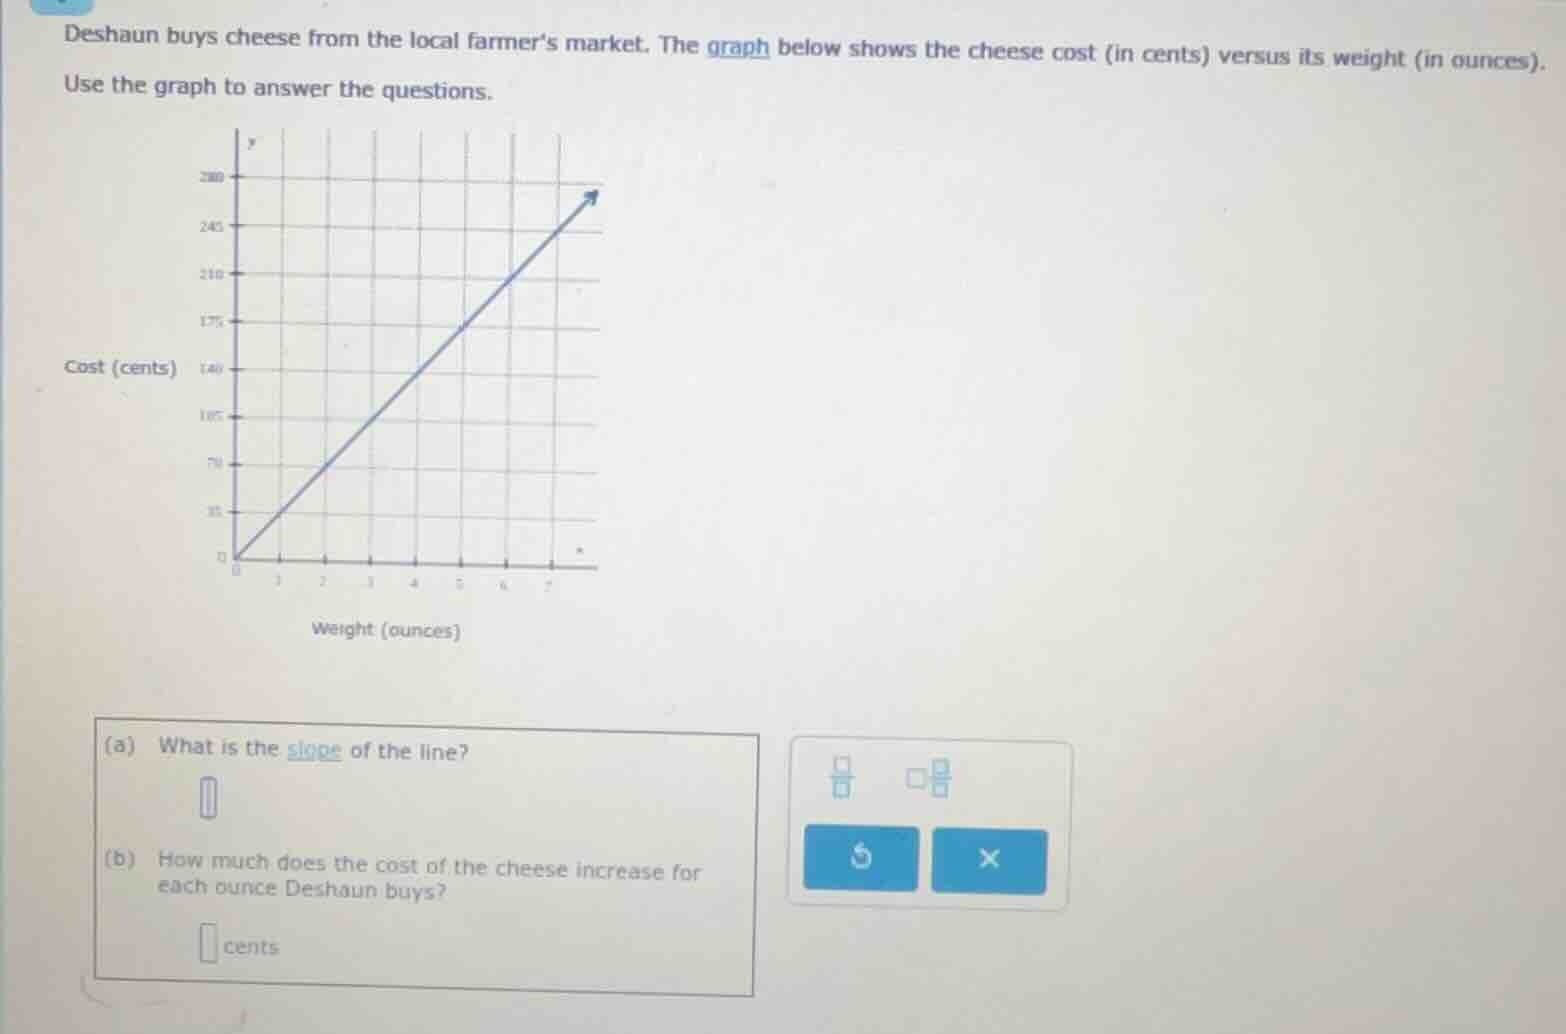
deshaun buys cheese from the local farmers market. the graph below shows the cheese cost (in cents) versus its weight (in ounces). use the graph to answer the questions. (a) what is the slope of the line? (b) how much does the cost of the cheese increase for each ounce deshaun buys? cents
Part (a)
Step1: Recall slope formula
The slope \( m \) of a line passing through two points \((x_1, y_1)\) and \((x_2, y_2)\) is given by \( m=\frac{y_2 - y_1}{x_2 - x_1} \). From the graph, we can take two points, for example, \((0, 0)\) and \((2, 70)\) (since at \( x = 2 \) ounces, \( y = 70 \) cents).
Step2: Calculate slope
Using the formula with \( x_1 = 0 \), \( y_1 = 0 \), \( x_2 = 2 \), \( y_2 = 70 \):
\( m=\frac{70 - 0}{2 - 0}=\frac{70}{2}=35 \)
The slope of the line representing cost vs. weight gives the rate of change of cost with respect to weight. In other words, it tells us how much the cost increases per ounce. From part (a), we found the slope is 35, which means the cost increases by 35 cents for each ounce bought.

Snap & solve any problem in the app
Get step-by-step solutions on Sovi AI
Photo-based solutions with guided steps
Explore more problems and detailed explanations
35