QUESTION IMAGE
Question
details
no additional details were added for this assignment.
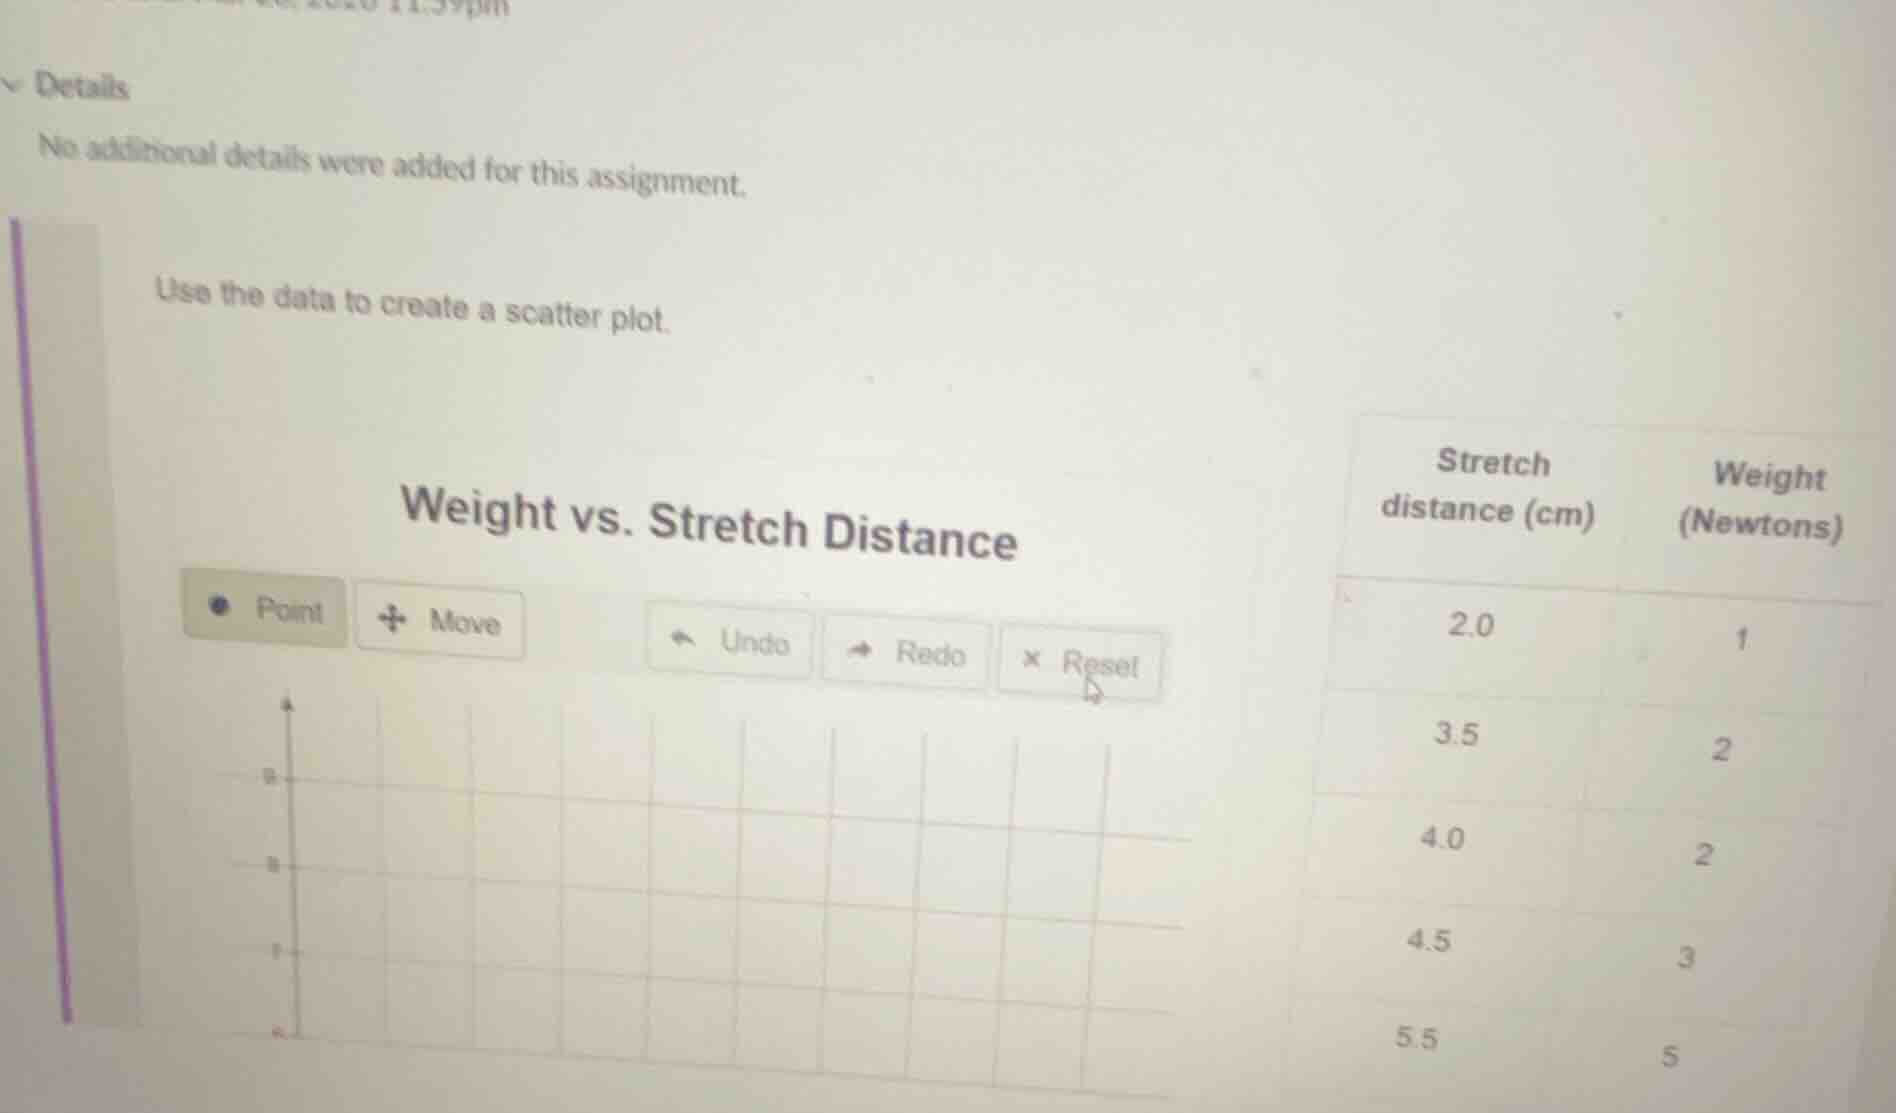
use the data to create a scatter plot.
weight vs. stretch distance
stretch distance (cm) weight (newtons)
2.0 1
3.5 2
4.0 2
4.5 3
5.5 5
Step1: Identify axis variables
Independent variable (x-axis): Weight (Newtons); Dependent variable (y-axis): Stretch distance (cm)
Step2: List data points
$(1, 2.0), (2, 3.5), (2, 4.0), (3, 4.5), (5, 5.5)$
Step3: Plot each data point
For each pair, place a dot at the corresponding x,y coordinate on the grid:
- At x=1, y=2.0: plot point
- At x=2, y=3.5: plot point
- At x=2, y=4.0: plot point
- At x=3, y=4.5: plot point
- At x=5, y=5.5: plot point

Snap & solve any problem in the app
Get step-by-step solutions on Sovi AI
Photo-based solutions with guided steps
Explore more problems and detailed explanations
A scatter plot with the following points plotted on a grid where the x-axis is "Weight (Newtons)" and y-axis is "Stretch distance (cm)":
- (1, 2.0)
- (2, 3.5)
- (2, 4.0)
- (3, 4.5)
- (5, 5.5)