QUESTION IMAGE
Question
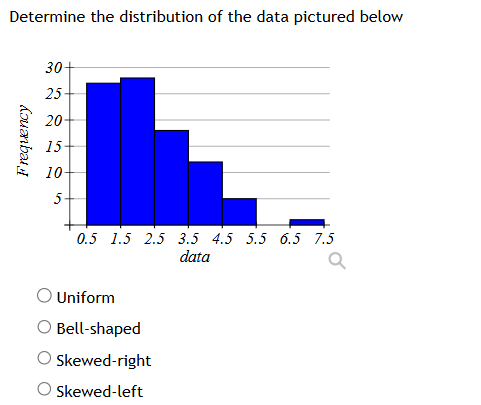
determine the distribution of the data pictured below
frequency
30
25
20
15
10
5
0.5 1.5 2.5 3.5 4.5 5.5 6.5 7.5
data
uniform
bell - shaped
skewed - right
skewed - left
Brief Explanations
To determine the distribution, we analyze the histogram:
- A uniform distribution has roughly equal frequencies across intervals. This is not the case here.
- A bell - shaped (normal) distribution is symmetric, with frequencies peaking in the middle and tapering off equally on both sides. Here, the right side tapers off more slowly with a long tail.
- A skewed - right distribution has a long tail on the right (higher values) side. The histogram shows that as the data values increase (move to the right on the x - axis), the frequency decreases, and there is a long tail on the right (e.g., the bar at 6.5 - 7.5 has a very low frequency, and the frequencies decrease as we move from left to right after the peak).
- A skewed - left distribution has a long tail on the left, which is not the case here.

Snap & solve any problem in the app
Get step-by-step solutions on Sovi AI
Photo-based solutions with guided steps
Explore more problems and detailed explanations
Skewed - right