QUESTION IMAGE
Question
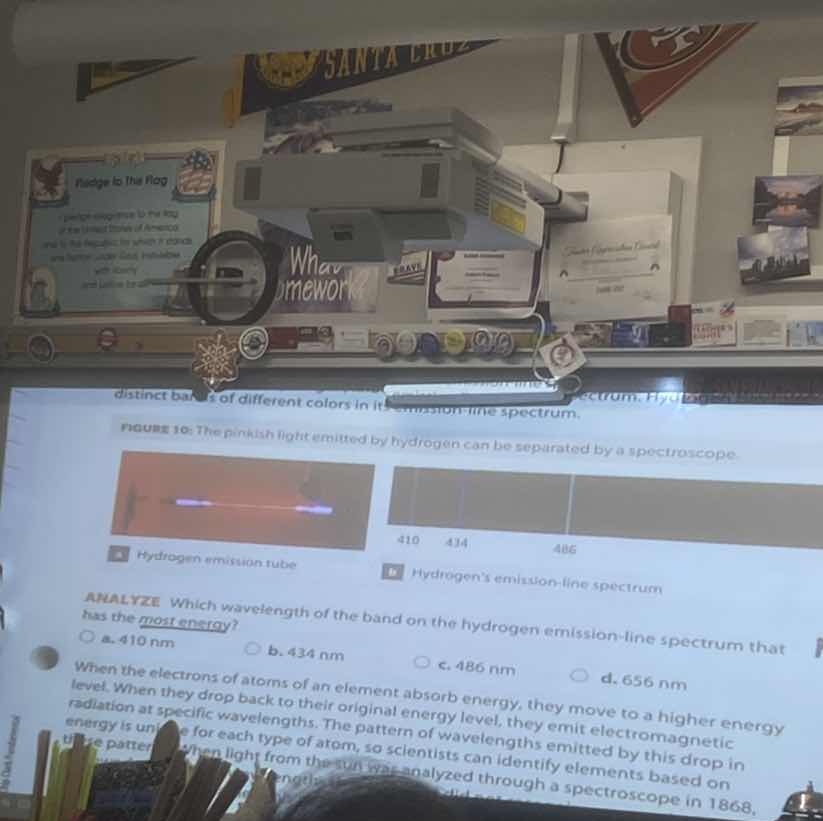
distinct bands of different colors in its emission - line spectrum. figure 10: the pinkish light emitted by hydrogen can be separated by a spectroscope. a hydrogen emission tube b hydrogens emission - line spectrum analyze which wavelength of the band on the hydrogen emission - line spectrum that has the most energy? a. 410 nm b. 434 nm c. 486 nm d. 656 nm when the electrons of atoms of an element absorb energy, they move to a higher energy level. when they drop back to their original energy level, they emit electromagnetic radiation at specific wavelengths. the pattern of wavelengths emitted by this drop in energy is unique for each type of atom, so scientists can identify elements based on this pattern. when light from the sun was analyzed through a spectroscope in 1868,
Step1: Recall energy-wavelength relation
The energy of a photon is given by $E = \frac{hc}{\lambda}$, where $h$ is Planck's constant, $c$ is the speed of light, and $\lambda$ is wavelength.
Step2: Relate wavelength to energy
Since $h$ and $c$ are constants, energy $E$ is inversely proportional to wavelength $\lambda$. This means the shorter the wavelength, the higher the energy.
Step3: Compare given wavelengths
The wavelengths are 410 nm, 434 nm, 486 nm, 656 nm. The shortest wavelength is 410 nm.

Snap & solve any problem in the app
Get step-by-step solutions on Sovi AI
Photo-based solutions with guided steps
Explore more problems and detailed explanations
a. 410 nm