QUESTION IMAGE
Question
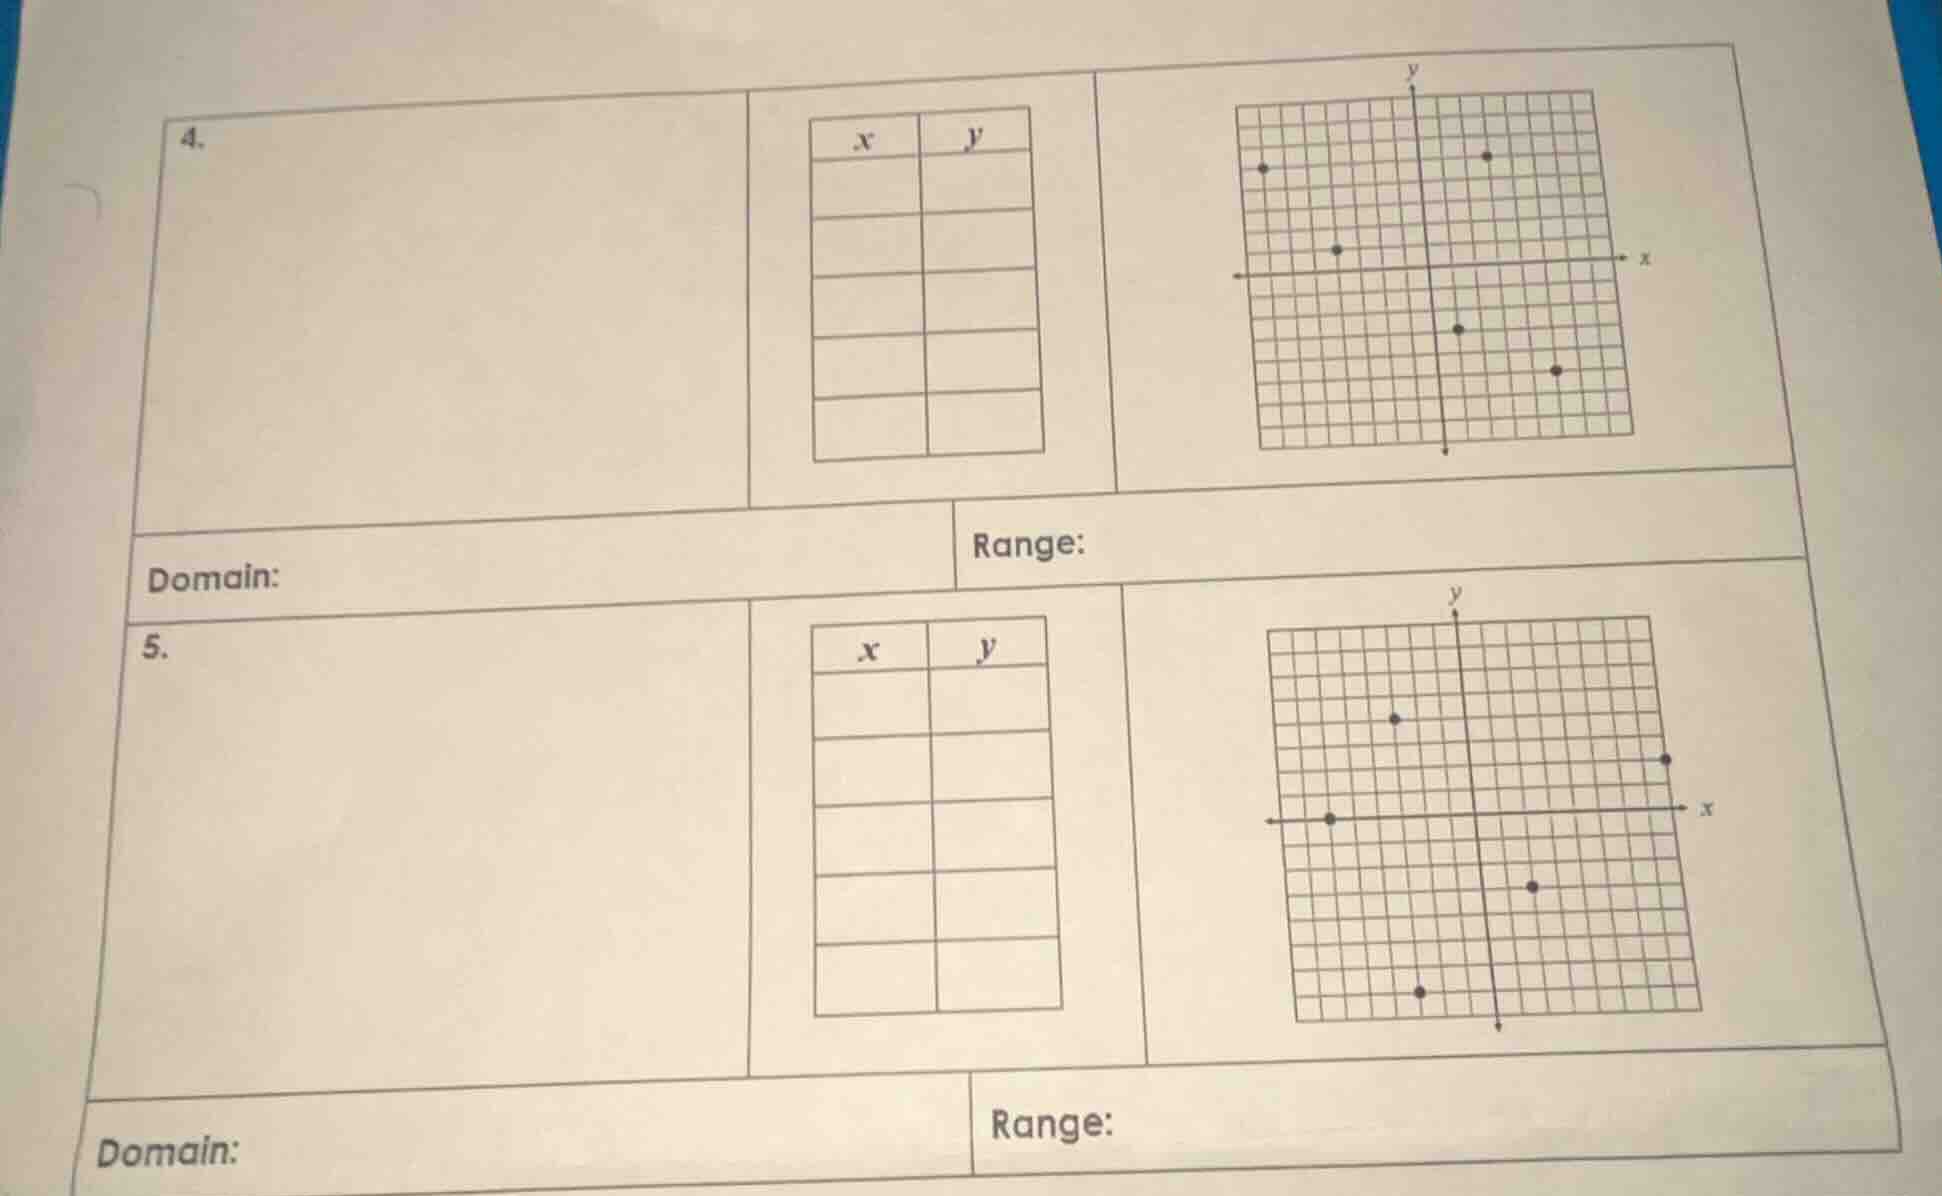
4.
domain:
range:
5.
domain:
range:
Problem 4:
Step1: Identify coordinates from graph
Looking at the first graph (for problem 4), the points are at:
- Let's assume each grid square is 1 unit. So the coordinates (x, y) are: (-8, 2), (-4, 0), (2, -2), (4, -4), (8, 2)? Wait, no, let's check the positions. Wait, the leftmost point: x=-8, y=2; then x=-4, y=0; x=2, y=-2; x=4, y=-4? Wait no, maybe I misread. Wait the graph has points: let's see the x and y axes. Wait the first graph (top right) has points:
- One at x=-8, y=2 (left side)
- One at x=-4, y=0 (left of y-axis, on x-axis)
- One at x=2, y=-2 (right of y-axis, below x-axis)
- One at x=4, y=-4 (right of y-axis, below x-axis)? Wait no, maybe the points are: (-8, 2), (-4, 0), (2, -2), (4, -4), (8, 2)? Wait no, the rightmost point is at x=8? Wait the grid: let's count the x-coordinates. From the origin (0,0), moving left: -8, -4; moving right: 2, 4, 8? Wait the points:
- Leftmost: x=-8, y=2
- Then x=-4, y=0
- Then x=2, y=-2? No, wait the point on the x-axis is at x=-4, y=0. Then the point below y-axis: x=2, y=-2? Wait no, the graph has five points? Wait the table has 5 rows. Let's list the coordinates:
- (-8, 2)
- (-4, 0)
- (2, -2)
- (4, -4)
- (8, 2) Wait, no, the rightmost point is at x=8? Wait the grid: each square is 1 unit. So:
- First point: x=-8, y=2 (left side, y=2)
- Second point: x=-4, y=0 (left of y-axis, on x-axis)
- Third point: x=2, y=-2? No, wait the point below y-axis: x=2, y=-2? Wait no, the point at x=2, y=-2? Wait the graph: let's check the y-axis. The top points: y=2 (both left and right), then y=0 (left of y-axis), y=-2 (right of y-axis, below), y=-4 (right of y-axis, below). Wait maybe the coordinates are:
(-8, 2), (-4, 0), (2, -2), (4, -4), (8, 2). Wait no, the rightmost point is at x=8, y=2? Wait the graph shows a point at x=8, y=2? Wait the original graph: let's see the top right graph for problem 4:
- Left point: x=-8, y=2
- Middle left: x=-4, y=0
- Middle right: x=2, y=-2? No, wait the point at x=2, y=-2? Wait no, the point below y-axis: x=2, y=-2? Wait the table has 5 rows, so 5 points. Let's list them:
- x=-8, y=2
- x=-4, y=0
- x=2, y=-2
- x=4, y=-4
- x=8, y=2
Step2: Fill the table
So the table for problem 4:
| x | y |
|---|---|
| -4 | 0 |
| 2 | -2 |
| 4 | -4 |
| 8 | 2 |
Step3: Find Domain and Range
Domain is the set of all x-values: {-8, -4, 2, 4, 8}
Range is the set of all y-values: {2, 0, -2, -4} Wait, no: y-values are 2, 0, -2, -4, 2. So unique y-values: {-4, -2, 0, 2}
Step1: Identify coordinates from graph
Looking at the second graph (for problem 5), the points are at:
- Let's count the grid squares. The points are:
- x=-8, y=0 (on x-axis, left)
- x=-4, y=4 (left of y-axis, above x-axis)
- x=-2, y=-4 (left of y-axis, below x-axis)
- x=4, y=-2 (right of y-axis, below x-axis)
- x=8, y=2 (right of y-axis, above x-axis) Wait, no, let's check the positions:
- Point on x-axis: x=-8, y=0
- Point above x-axis, left of y-axis: x=-4, y=4
- Point below x-axis, left of y-axis: x=-2, y=-4
- Point below x-axis, right of y-axis: x=4, y=-2
- Point above x-axis, right of y-axis: x=8, y=2
Step2: Fill the table
So the table for problem 5:
| x | y |
|---|---|
| -4 | 4 |
| -2 | -4 |
| 4 | -2 |
| 8 | 2 |
Step3: Find Domain and Range
Domain is the set of all x-values: {-8, -4, -2, 4, 8}
Range is the set of all y-values: {0, 4, -4, -2, 2} (unique values: {-4, -2, 0, 2, 4})

Snap & solve any problem in the app
Get step-by-step solutions on Sovi AI
Photo-based solutions with guided steps
Explore more problems and detailed explanations
(Problem 4):
Table:
| x | y |
|---|---|
| -4 | 0 |
| 2 | -2 |
| 4 | -4 |
| 8 | 2 |
Domain: {-8, -4, 2, 4, 8}
Range: {-4, -2, 0, 2}