QUESTION IMAGE
Question
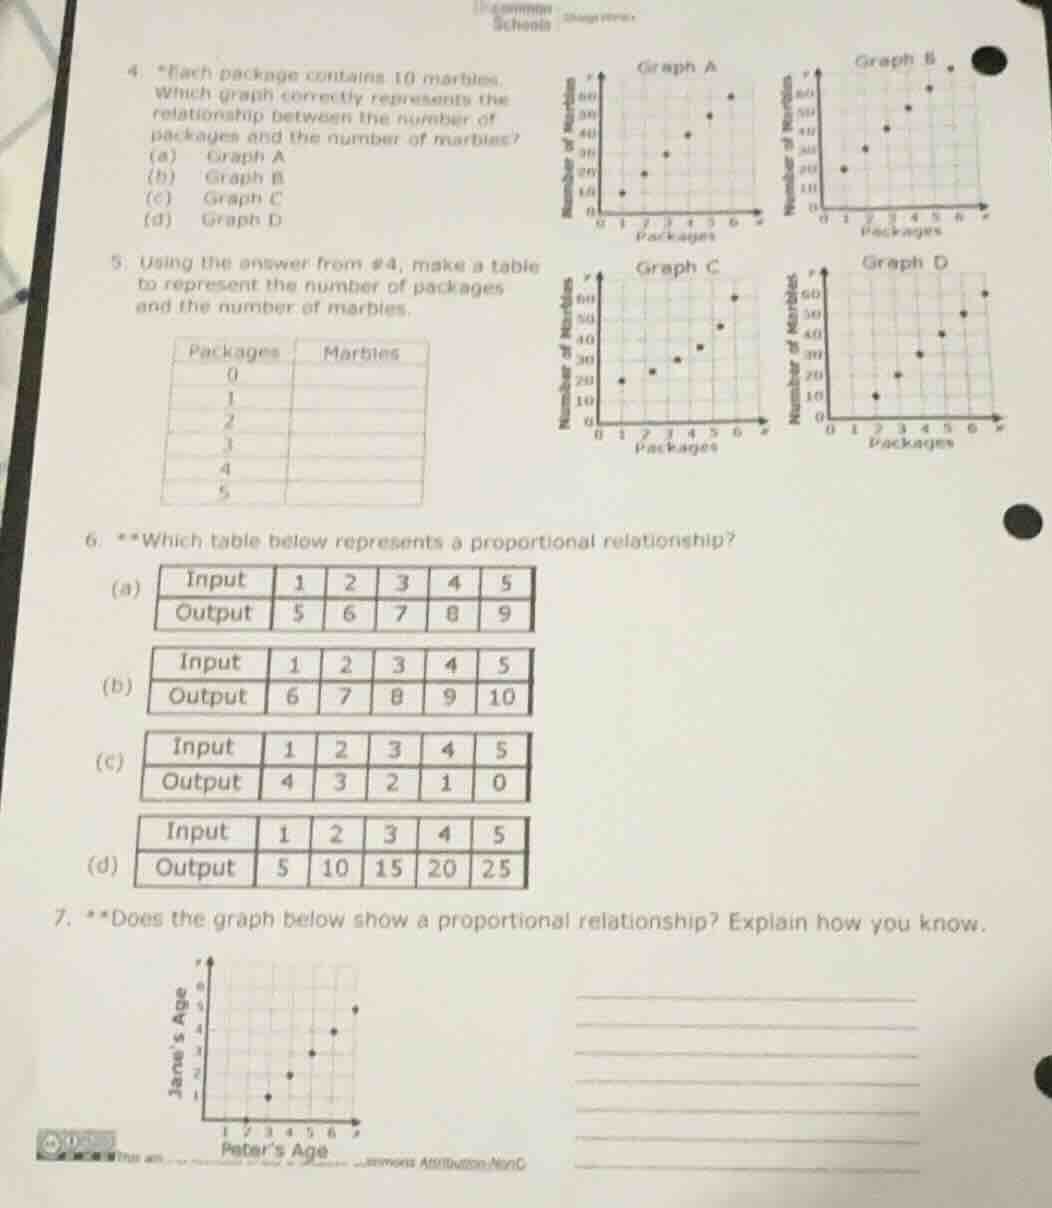
- *each package contains 10 marbles. which graph correctly represents the relationship between the number of packages and the number of marbles? (a) graph a (b) graph b (c) graph c (d) graph d 5. using the answer from #4, make a table to represent the number of packages and the number of marbles. packages marbles 0 1 2 3 4 5 6. which table below represents a proportional relationship? (a) input 1 2 3 4 5 output 5 6 7 8 9 (b) input 1 2 3 4 5 output 6 7 8 9 10 (c) input 1 2 3 4 5 output 4 3 2 1 0 (d) input 1 2 3 4 5 output 5 10 15 20 25 7. does the graph below show a proportional relationship? explain how you know.
Response
Question 4
Step1: Define proportional relationship
The number of marbles $M$ is $10$ times the number of packages $P$, so $M=10P$. This is a proportional relationship passing through $(0,0)$, with constant slope $10$.
Step2: Check each graph
- Graph A: Points are $(1,20),(2,30),(3,40),(4,40),(5,50),(6,60)$. Slope between points is not 10, and $(0,0)$ is not plotted.
- Graph B: Points are $(1,20),(2,30),(3,40),(4,50),(5,60),(6,70)$. Slope is 10, but does not pass through $(0,0)$ (0 packages = 0 marbles, which is missing).
- Graph C: Points are $(1,20),(2,20),(3,30),(4,40),(5,50),(6,60)$. Slope is inconsistent.
- Graph D: Points are $(1,10),(2,20),(3,30),(4,40),(5,50),(6,60)$. This follows $M=10P$, and $(0,0)$ would fit the relationship.
Step1: Use the formula $M=10P$
Calculate marbles for each package count.
Step2: Compute values
For $P=0$: $M=10\times0=0$
For $P=1$: $M=10\times1=10$
For $P=2$: $M=10\times2=20$
For $P=3$: $M=10\times3=30$
For $P=4$: $M=10\times4=40$
For $P=5$: $M=10\times5=50$
Step1: Define proportional relationship
A proportional relationship has $\frac{\text{Output}}{\text{Input}} = k$ (constant) for all non-zero inputs, and output=0 when input=0.
Step2: Check each table
- (a): $\frac{5}{1}=5$, $\frac{6}{2}=3$ → Not constant.
- (b): $\frac{6}{1}=6$, $\frac{7}{2}=3.5$ → Not constant.
- (c): $\frac{4}{1}=4$, $\frac{3}{2}=1.5$ → Not constant.
- (d): $\frac{5}{1}=5$, $\frac{10}{2}=5$, $\frac{15}{3}=5$, $\frac{20}{4}=5$, $\frac{25}{5}=5$ → Constant $k=5$.

Snap & solve any problem in the app
Get step-by-step solutions on Sovi AI
Photo-based solutions with guided steps
Explore more problems and detailed explanations
(d) Graph D
---