QUESTION IMAGE
Question
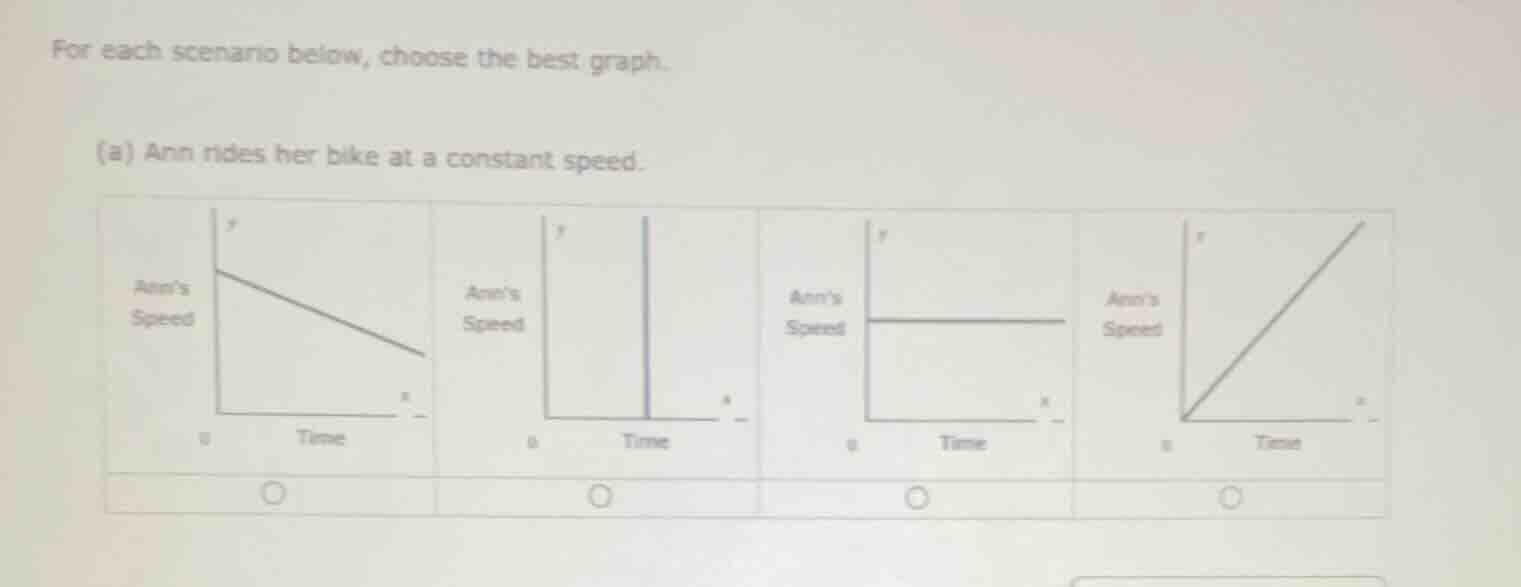
for each scenario below, choose the best graph.
(a) ann rides her bike at a constant speed.
Brief Explanations
When speed is constant, the graph of speed (y - axis) vs. time (x - axis) should be a horizontal line because speed does not change with time. The first graph shows speed decreasing, the second is a vertical line (not representing constant speed), the fourth shows speed increasing. The third graph has a horizontal line, meaning speed is constant over time.

Snap & solve any problem in the app
Get step-by-step solutions on Sovi AI
Photo-based solutions with guided steps
Explore more problems and detailed explanations
The third graph (the one with the horizontal line for Ann's Speed vs. Time)