QUESTION IMAGE
Question
ebra i b-cr
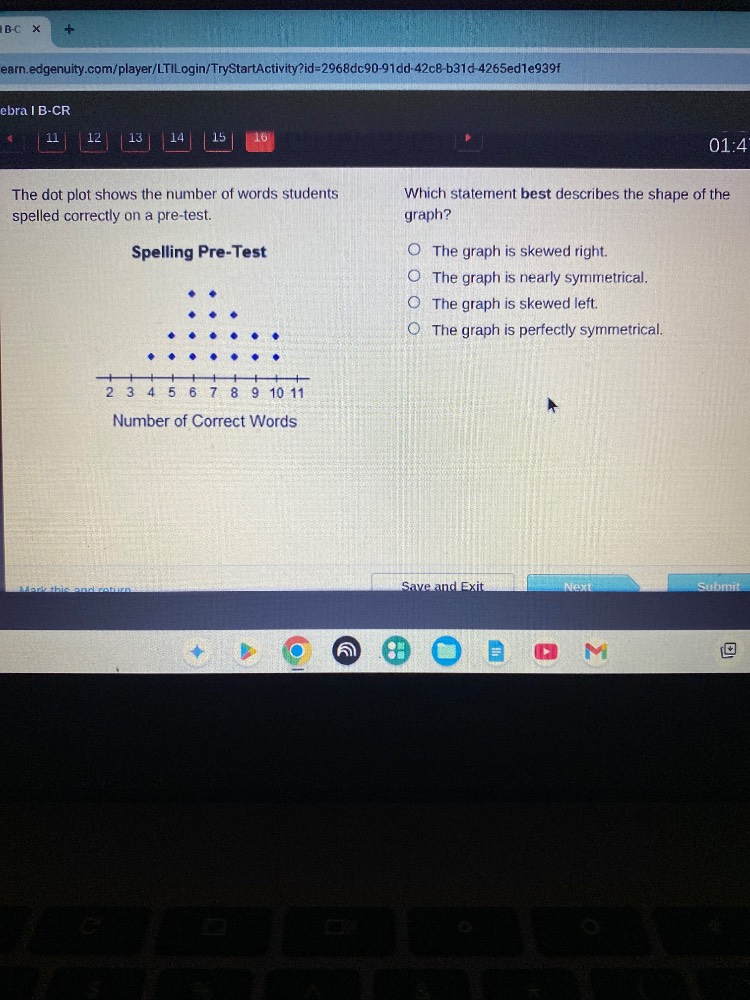
the dot plot shows the number of words students spelled correctly on a pre-test.
spelling pre-test
number of correct words
which statement best describes the shape of the graph?
the graph is skewed right.
the graph is nearly symmetrical.
the graph is skewed left.
the graph is perfectly symmetrical.
A skewed left graph has a longer tail on the left side. Observing the dot plot, there are fewer data points (dots) on the left (lower values: 3,4) and the bulk of data is shifted to the right, creating a leftward tail. This matches the definition of a left-skewed distribution, and it is not perfectly or nearly symmetrical, nor skewed right.

Snap & solve any problem in the app
Get step-by-step solutions on Sovi AI
Photo-based solutions with guided steps
Explore more problems and detailed explanations
The graph is skewed left.