QUESTION IMAGE
Question
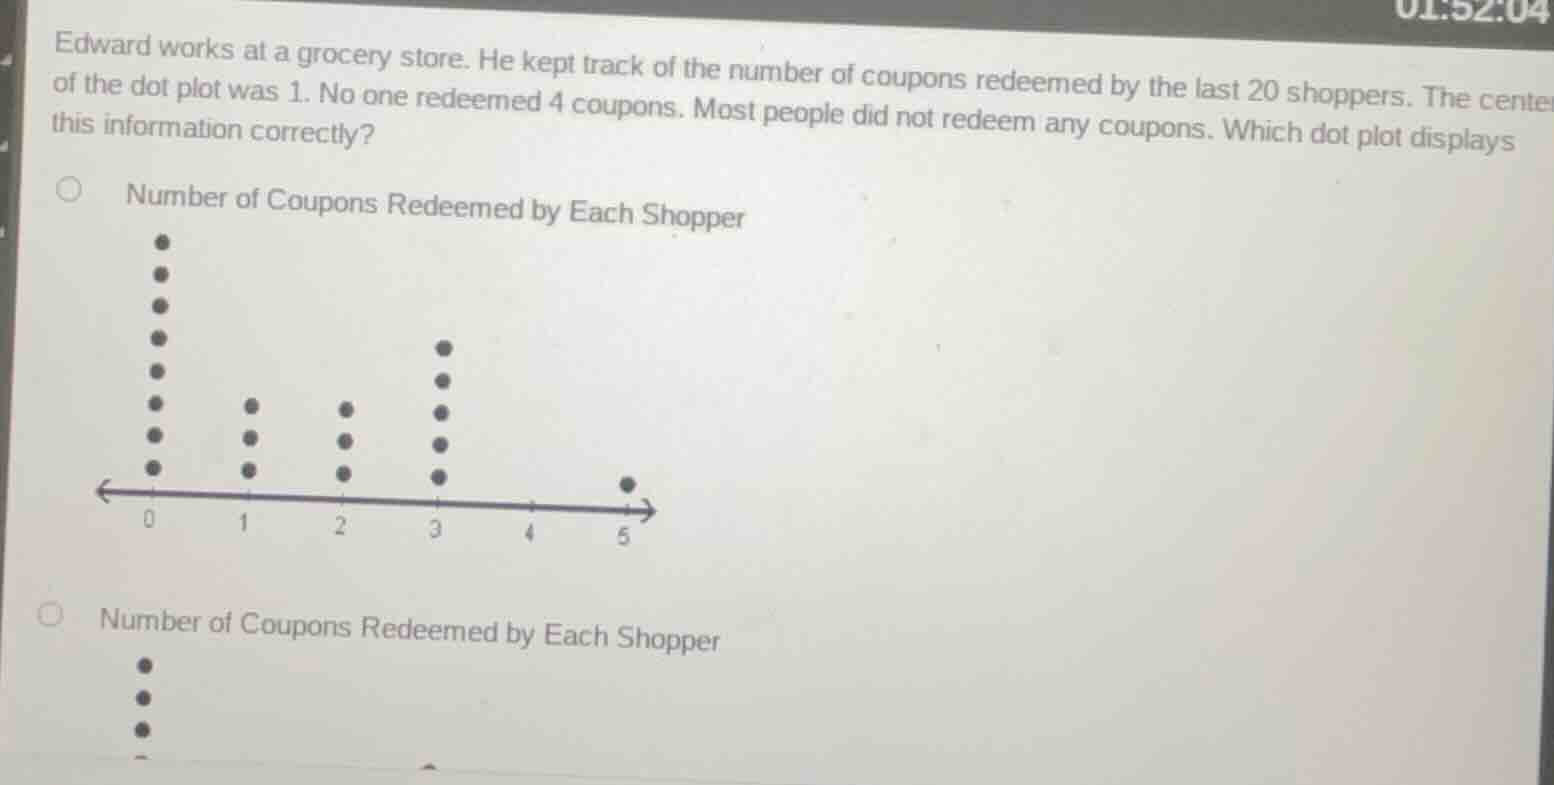
edward works at a grocery store. he kept track of the number of coupons redeemed by the last 20 shoppers. the center of the dot plot was 1. no one redeemed 4 coupons. most people did not redeem any coupons. which dot plot displays this information correctly?
number of coupons redeemed by each shopper
dot plot with dots at 0 (many), 1 (some), 2 (some), 3 (some), 5 (one), 4 (none)
number of coupons redeemed by each shopper
partial dot plot with dots at 0 (few)
Step1: Count total dots (first plot)
Count dots: $8 + 3 + 3 + 5 + 0 + 1 = 20$ (matches 20 shoppers)
Step2: Check center (median)
Order data: 8 zeros, 3 ones, 3 twos, 5 threes, 1 five. Median is average of 10th & 11th values: $\frac{1+1}{2}=1$ (matches given center)
Step3: Check 4 coupons
0 dots at 4 (matches "no one redeemed 4")
Step4: Check most shoppers
8 dots at 0 (most did not redeem, matches)
Step5: Verify second plot
Only partial, can't meet 20 shoppers, fails criteria.

Snap & solve any problem in the app
Get step-by-step solutions on Sovi AI
Photo-based solutions with guided steps
Explore more problems and detailed explanations
The first dot plot labeled "Number of Coupons Redeemed by Each Shopper" (with 8 dots at 0, 3 at 1, 3 at 2, 5 at 3, 0 at 4, 1 at 5)