QUESTION IMAGE
Question
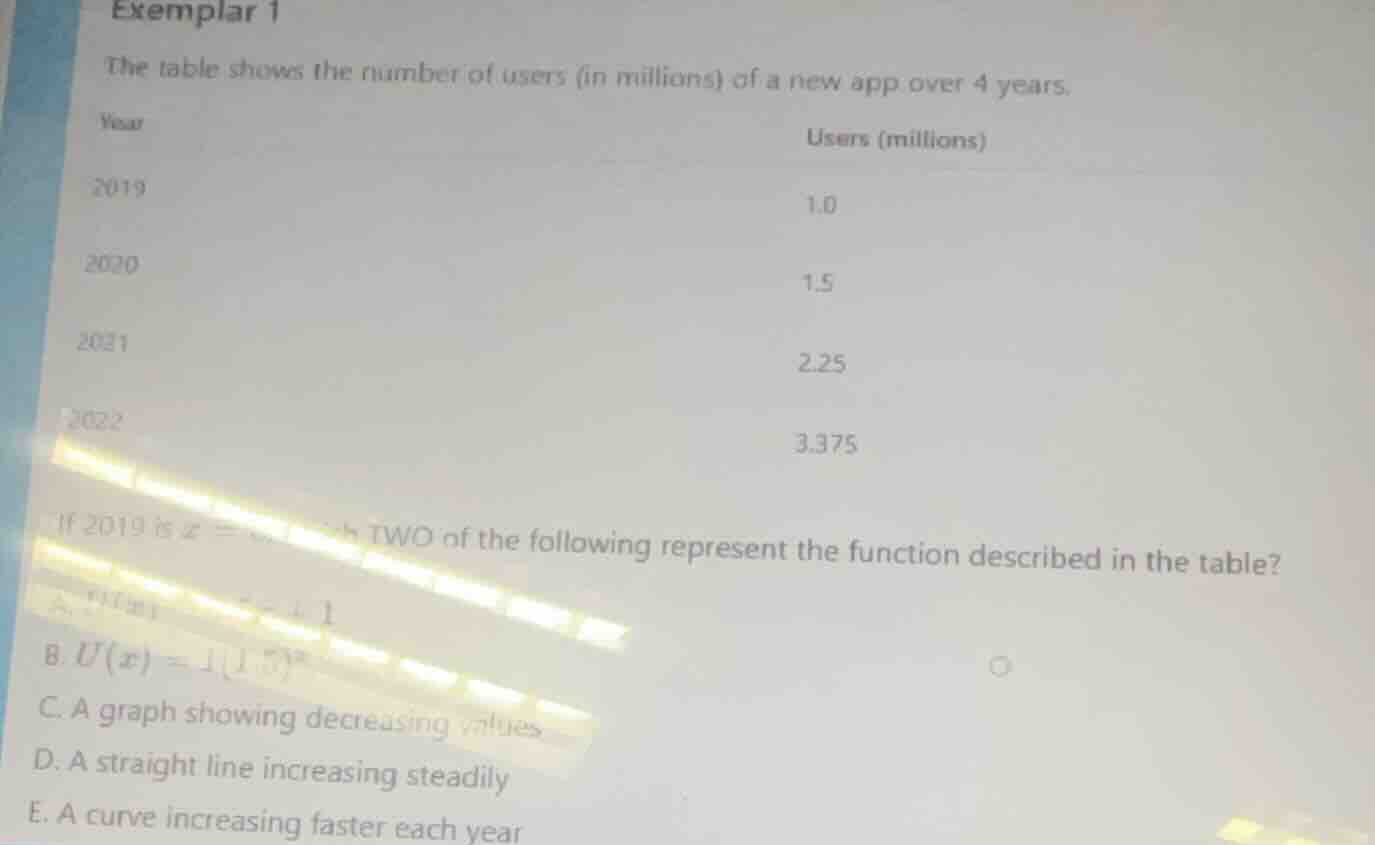
exemplar 1
the table shows the number of users (in millions) of a new app over 4 years.
year\tusers (millions)
2019\t1.0
2020\t1.5
2021\t2.25
2022\t3.375
if 2019 is ( x = 0 ), which two of the following represent the function described in the table?
a. partially obscured
b. ( u(x) = 1(1.5)^x ) partially obscured
c. a graph showing decreasing values
d. a straight line increasing steadily
e. a curve increasing faster each year
To solve this, we first analyze the pattern in the number of users:
- From 2019 to 2020: \( \frac{1.5}{1.0} = 1.5 \)
- From 2020 to 2021: \( \frac{2.25}{1.5} = 1.5 \)
- From 2021 to 2022: \( \frac{3.375}{2.25} = 1.5 \)
This is a geometric sequence with a common ratio of \( 1.5 \). Let \( x \) represent the number of years since 2019 (so \( x = 0 \) for 2019, \( x = 1 \) for 2020, etc.). The function for a geometric sequence is \( U(x) = a \cdot r^x \), where \( a = 1.0 \) (initial value) and \( r = 1.5 \). Thus, \( U(x) = 1.0(1.5)^x \) (matching option B, assuming a typo in the original, e.g., \( U(x) = 1(1.5)^x \)).
For the graph: A geometric sequence with \( r > 1 \) is an exponential growth function, which is a curve that increases faster each year (since the rate of growth accelerates). A straight line (option D) is linear growth (constant slope), but this is exponential. A decreasing graph (option C) is incorrect, as users are increasing.
Step 1: Identify the Pattern
Calculate the ratio between consecutive years:
\( \frac{1.5}{1.0} = 1.5 \), \( \frac{2.25}{1.5} = 1.5 \), \( \frac{3.375}{2.25} = 1.5 \). This is a geometric sequence with \( r = 1.5 \).
Step 2: Analyze the Function
The general form for a geometric sequence is \( U(x) = a \cdot r^x \), where \( a = 1.0 \) (2019 users) and \( r = 1.5 \). Thus, \( U(x) = 1(1.5)^x \) (matches option B, assuming formatting issues).
Step 3: Analyze the Graph
- Exponential growth (\( r > 1 \)) produces a curve that increases faster each year (option E), as the rate of growth accelerates (e.g., 2019→2020: +0.5M; 2020→2021: +0.75M; 2021→2022: +1.125M).
- A straight line (D) is linear (constant increase), but this is exponential. A decreasing graph (C) is wrong.
Final Answer
The two correct options are:
B. \( U(x) = 1(1.5)^x \) (assuming formatting)
E. A curve increasing faster each year

Snap & solve any problem in the app
Get step-by-step solutions on Sovi AI
Photo-based solutions with guided steps
Explore more problems and detailed explanations
To solve this, we first analyze the pattern in the number of users:
- From 2019 to 2020: \( \frac{1.5}{1.0} = 1.5 \)
- From 2020 to 2021: \( \frac{2.25}{1.5} = 1.5 \)
- From 2021 to 2022: \( \frac{3.375}{2.25} = 1.5 \)
This is a geometric sequence with a common ratio of \( 1.5 \). Let \( x \) represent the number of years since 2019 (so \( x = 0 \) for 2019, \( x = 1 \) for 2020, etc.). The function for a geometric sequence is \( U(x) = a \cdot r^x \), where \( a = 1.0 \) (initial value) and \( r = 1.5 \). Thus, \( U(x) = 1.0(1.5)^x \) (matching option B, assuming a typo in the original, e.g., \( U(x) = 1(1.5)^x \)).
For the graph: A geometric sequence with \( r > 1 \) is an exponential growth function, which is a curve that increases faster each year (since the rate of growth accelerates). A straight line (option D) is linear growth (constant slope), but this is exponential. A decreasing graph (option C) is incorrect, as users are increasing.
Step 1: Identify the Pattern
Calculate the ratio between consecutive years:
\( \frac{1.5}{1.0} = 1.5 \), \( \frac{2.25}{1.5} = 1.5 \), \( \frac{3.375}{2.25} = 1.5 \). This is a geometric sequence with \( r = 1.5 \).
Step 2: Analyze the Function
The general form for a geometric sequence is \( U(x) = a \cdot r^x \), where \( a = 1.0 \) (2019 users) and \( r = 1.5 \). Thus, \( U(x) = 1(1.5)^x \) (matches option B, assuming formatting issues).
Step 3: Analyze the Graph
- Exponential growth (\( r > 1 \)) produces a curve that increases faster each year (option E), as the rate of growth accelerates (e.g., 2019→2020: +0.5M; 2020→2021: +0.75M; 2021→2022: +1.125M).
- A straight line (D) is linear (constant increase), but this is exponential. A decreasing graph (C) is wrong.
Final Answer
The two correct options are:
B. \( U(x) = 1(1.5)^x \) (assuming formatting)
E. A curve increasing faster each year