QUESTION IMAGE
Question
exercises 17 and 18 refer to the following setting. during the winter months, outside temperatures at the starneses cabin in colorado can stay well below freezing (32°f, or 0°c) for weeks at a time. to prevent the pipes from freezing, mrs. starnes sets the thermostat at 50°f. the manufacturer claims that the thermostat allows variation in home temperature that follows a normal distribution with (sigma = 3^circ)f. to test this claim, mrs. starnes programs her digital thermometer to take an srs of (n = 10) readings during a 24 - hour period. suppose the thermostat is working properly and that the actual temperature readings vary according to a normal distribution with mean (mu = 50^circ)f and standard deviation (sigma = 3^circ)f.
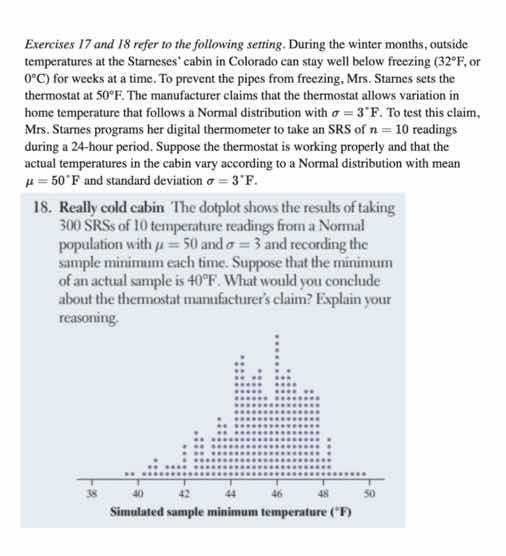
- really cold cabin the dotplot shows the results of taking 500 srss of 10 temperature readings from a normal population with (mu = 50) and (sigma = 3) and recording the sample minimum each time. suppose that the minimum of an actual sample is (40^circ)f. what would you conclude about the thermostat manufacturers claim? explain your reasoning.
Step1: Analyze the Dotplot
The dotplot shows the distribution of sample minimum temperatures from 500 SRSs (Simple Random Samples) of size \( n = 10 \) from a Normal population with \( \mu = 50^{\circ}\text{F} \) and \( \sigma = 3^{\circ}\text{F} \). We observe the frequency of sample minima.
Step2: Compare Observed Minimum
The actual sample minimum is \( 40^{\circ}\text{F} \). From the dotplot, we can see that a sample minimum of \( 40^{\circ}\text{F} \) (or lower) occurs very rarely (if at all) in the 500 simulated samples.
Step3: Evaluate the Claim
If the thermostat were working properly (i.e., the population has \( \mu = 50^{\circ}\text{F} \) and \( \sigma = 3^{\circ}\text{F} \)), getting a sample minimum as low as \( 40^{\circ}\text{F} \) should be extremely unlikely. Since we observed such a low minimum, this provides evidence against the manufacturer's claim that the home temperature follows a Normal distribution with \( \mu = 50^{\circ}\text{F} \) and \( \sigma = 3^{\circ}\text{F} \) (or at least suggests that the thermostat may not be operating as claimed, as such a low minimum is inconsistent with the supposed distribution).

Snap & solve any problem in the app
Get step-by-step solutions on Sovi AI
Photo-based solutions with guided steps
Explore more problems and detailed explanations
If the thermostat were working properly (with \( \mu = 50^{\circ}\text{F} \) and \( \sigma = 3^{\circ}\text{F} \)), a sample minimum of \( 40^{\circ}\text{F} \) would be extremely unlikely (rarely seen in 500 simulated samples). Thus, the observed \( 40^{\circ}\text{F} \) minimum provides evidence against the manufacturer's claim that the temperature variation follows \( N(50, 3) \).