QUESTION IMAGE
Question
exercises
chapter 1 appendix: how to read
and understand graphs
learning objective: understand how data can be graphically
represented.
1a.1 graph each of the following sets of numbers. draw a line
through the points and calculate the slope of each line.
1 2 3 4 5 6
x y x y x y x y x y x y
2 8 2 40 0 0 0 12 0 0 0.1 1.6
4 16 4 32 0 3 0 9 0 0 0.2 1.2
6 24 6 24 6 6 6 6 6 6 0.3 80
8 32 8 16 9 9 9 3 9 3 0.4 40
10 40 10 8 12 12 12 0 12 0 0.5 0
1a.2 for each of the graphs in figure 1, determine whether the
curve has a positive or negative slope. give an intuitive
explanation for what is happening with the slope of each
curve.
1a.3 the following table shows the relationship between the price
of airline tickets from london to new york and the number of
passengers on the flight.
a. is the relationship between the price of tickets from
london to new york and the number of passengers
a positive or a negative relationship? explain.
b. plot the data from the table on a graph, draw a line through
the points, and calculate the slope of the line.
price per ticket
number of
passengers
(millions)
month
$ 300
120
june
500
200
july
800
320
august
600
240
september
450
180
october
exercises
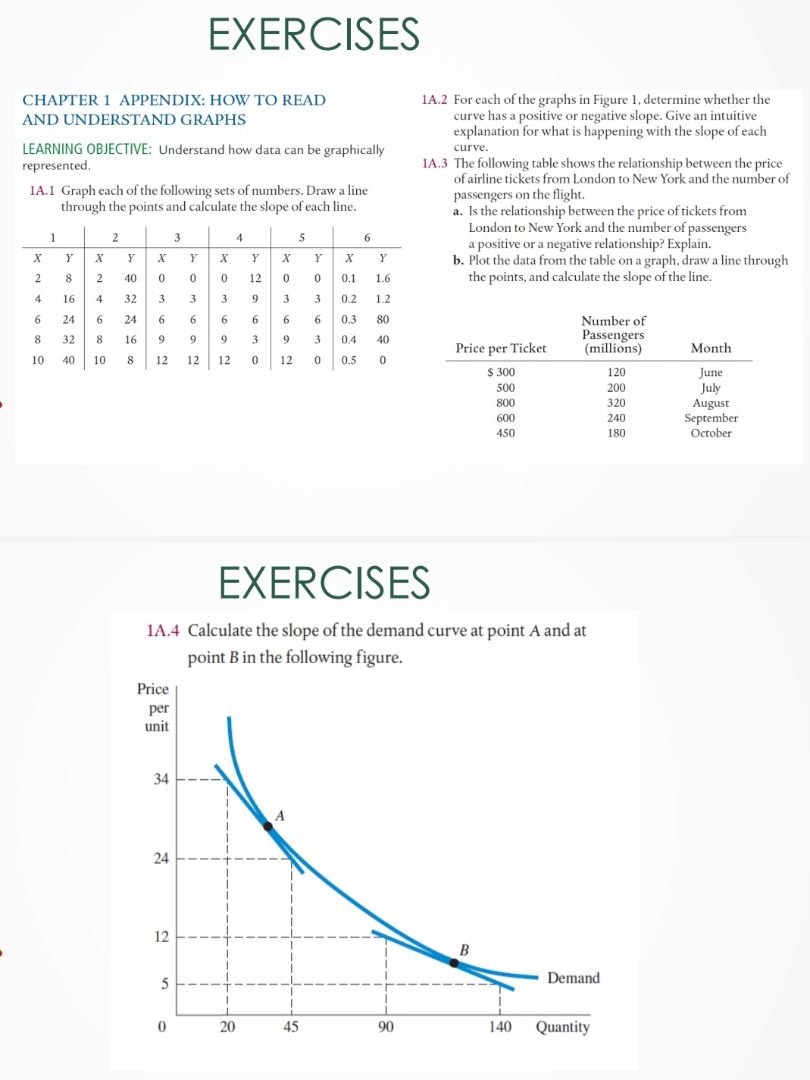
1a.4 calculate the slope of the demand curve at point a and at
point b in the following figure.
(figure: price per unit on y - axis, quantity on x - axis. demand curve with points a (45, 24 - 34 range) and b (140, 5 - 12 range), grid with 0, 20, 45, 90, 140 on x; 0, 5, 12, 24, 34 on y.)
Let's solve 1A.4 step by step. We need to calculate the slope of the demand curve at point A and point B. The slope of a curve at a point can be approximated by the slope of the tangent line at that point. But in this case, we can use the two - point formula for slope, $m=\frac{y_2 - y_1}{x_2 - x_1}$, where $(x_1,y_1)$ and $(x_2,y_2)$ are two points on the tangent line (or the line we use to approximate the slope at the point).
For Point A:
We can see from the graph that for the tangent line at point A, we can use the points (20, 34) and (45, 24) (we assume these are points on the tangent line).
Step 1: Identify the coordinates
Let $(x_1,y_1)=(20,34)$ and $(x_2,y_2)=(45,24)$
Step 2: Apply the slope formula
The slope formula is $m=\frac{y_2 - y_1}{x_2 - x_1}$
Substitute the values: $m=\frac{24 - 34}{45 - 20}=\frac{- 10}{25}=-\frac{2}{5}=- 0.4$
For Point B:
We can use the points (90, 12) and (140, 5) (points on the tangent line at point B)
Step 1: Identify the coordinates
Let $(x_1,y_1)=(90,12)$ and $(x_2,y_2)=(140,5)$
Step 2: Apply the slope formula
Using the slope formula $m=\frac{y_2 - y_1}{x_2 - x_1}$
Substitute the values: $m=\frac{5 - 12}{140 - 90}=\frac{-7}{50}=- 0.14$

Snap & solve any problem in the app
Get step-by-step solutions on Sovi AI
Photo-based solutions with guided steps
Explore more problems and detailed explanations
Slope at point A: $\boldsymbol{- 0.4}$; Slope at point B: $\boldsymbol{-0.14}$