QUESTION IMAGE
Question
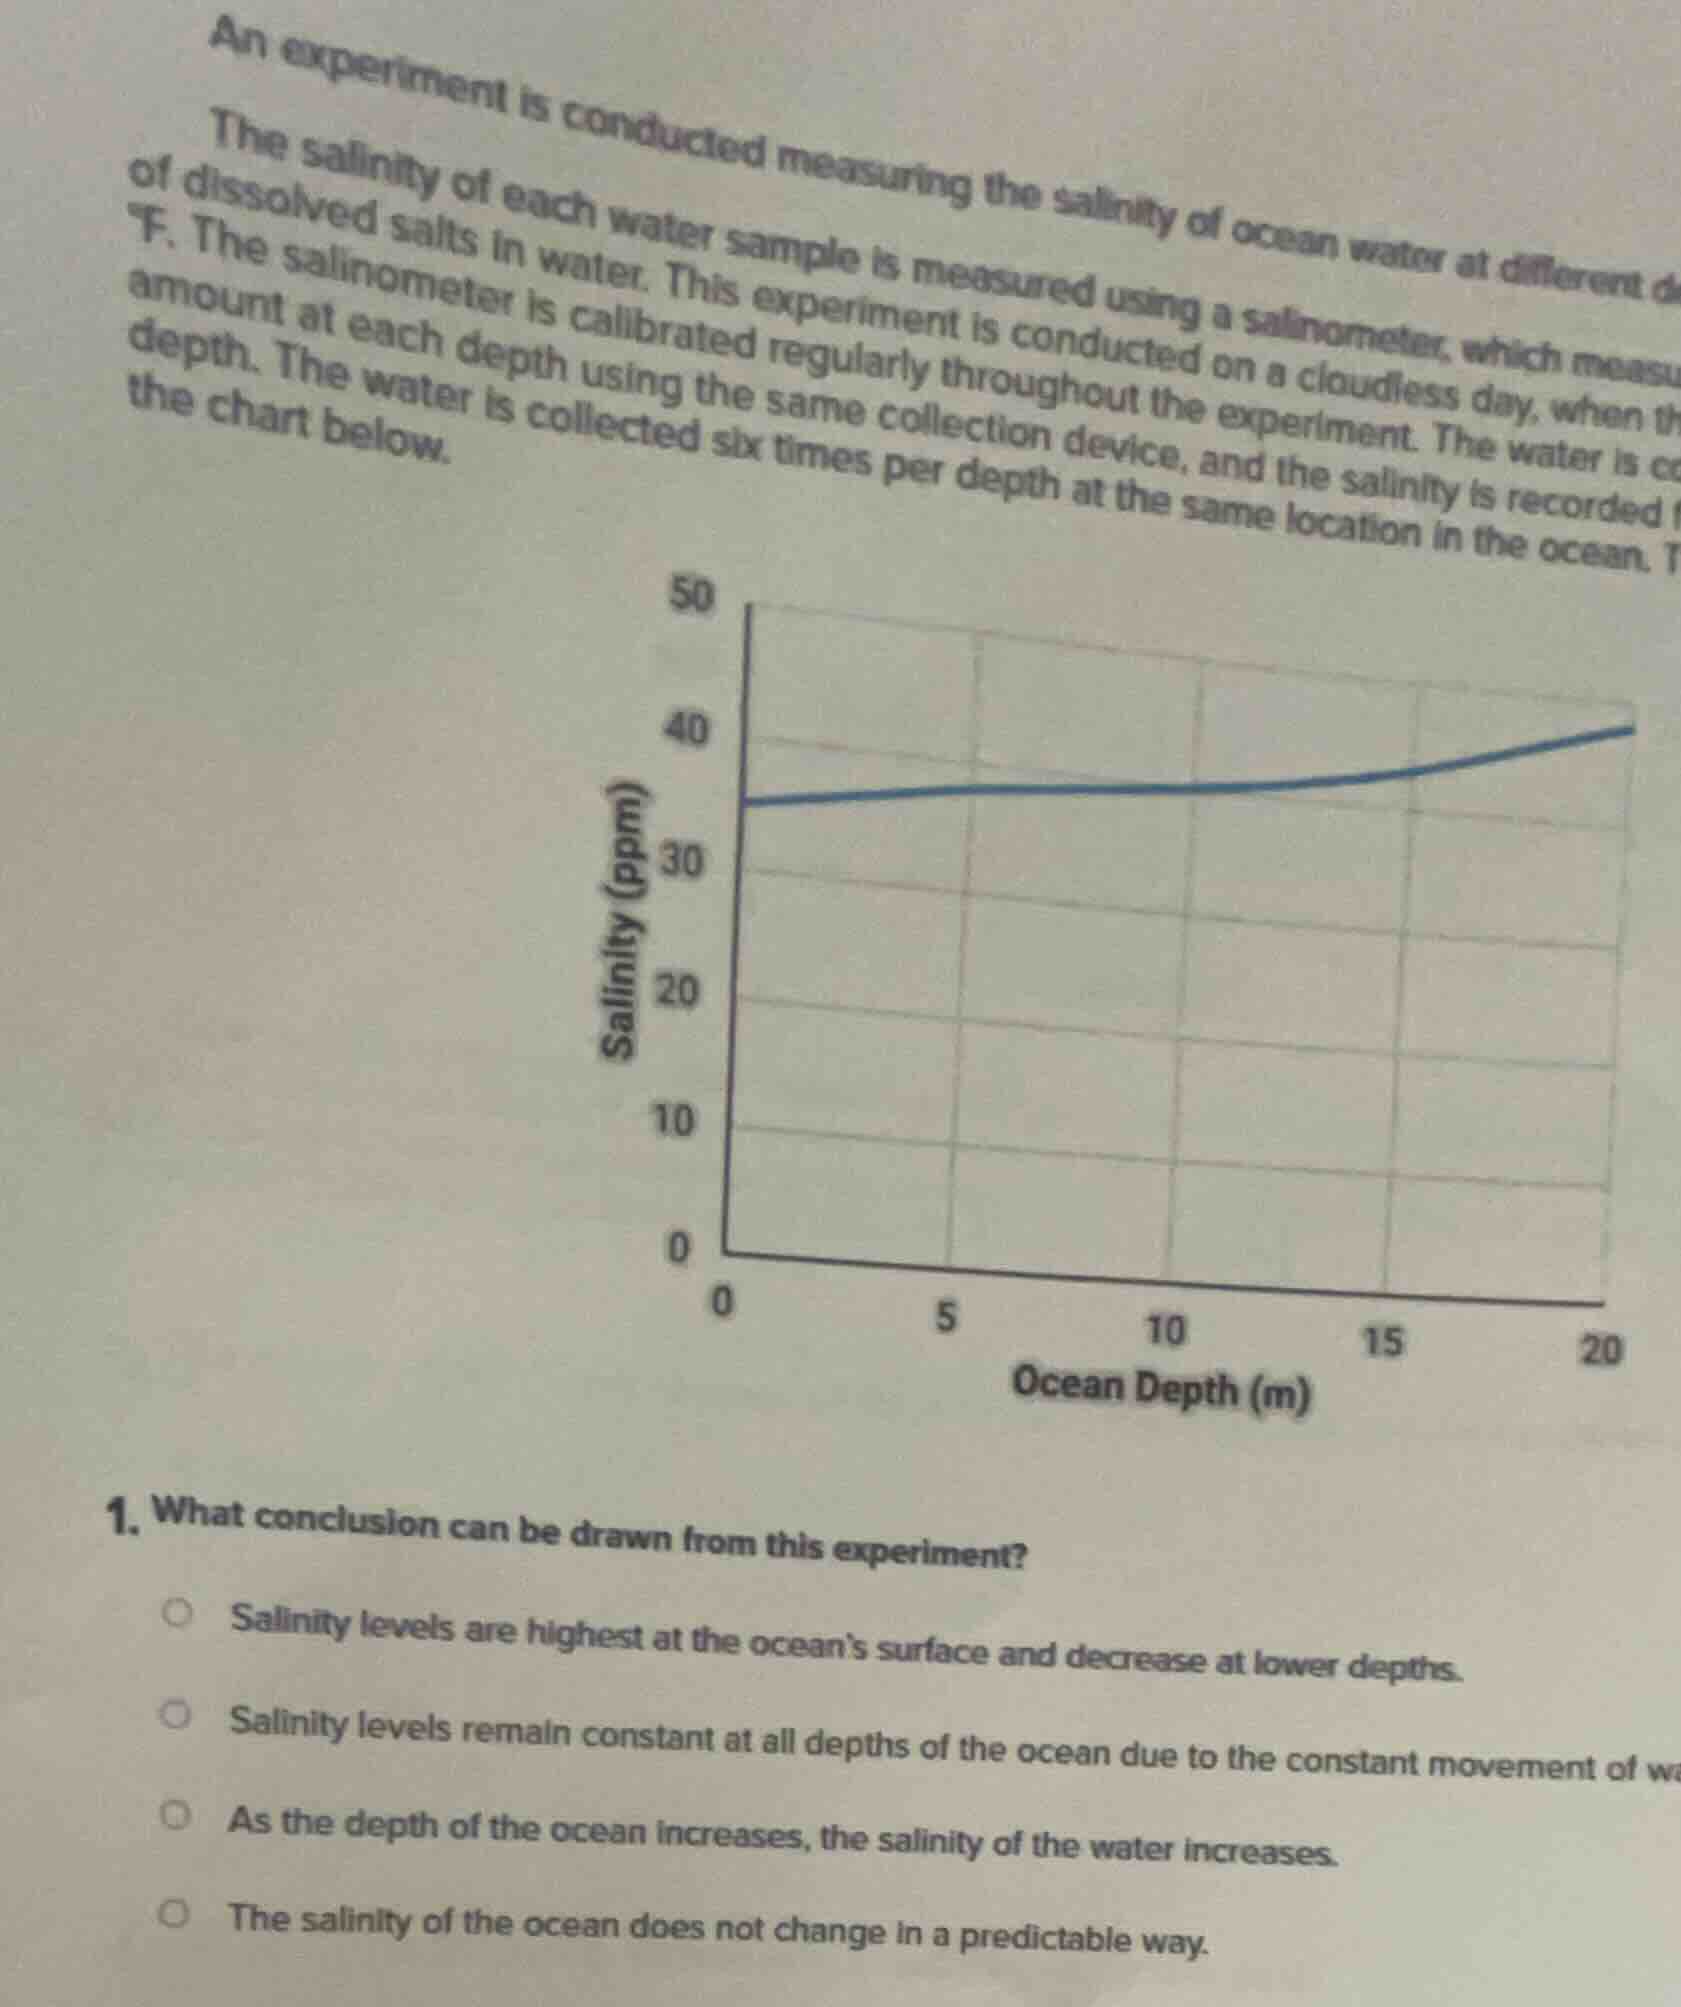
an experiment is conducted measuring the salinity of ocean water at different d
the salinity of each water sample is measured using a salinometer, which measu of dissolved salts in water. this experiment is conducted on a cloudless day, when th
°f. the salinometer is calibrated regularly throughout the experiment. the water is co
amount at each depth using the same collection device, and the salinity is recorded f
depth. the water is collected six times per depth at the same location in the ocean. t
the chart below.
- what conclusion can be drawn from this experiment?
salinity levels are highest at the ocean’s surface and decrease at lower depths.
salinity levels remain constant at all depths of the ocean due to the constant movement of w
as the depth of the ocean increases, the salinity of the water increases.
the salinity of the ocean does not change in a predictable way.
The line graph shows that as ocean depth (x-axis, measured in meters) increases from 0 to 20 m, salinity (y-axis, measured in ppm) rises gradually. We match this trend to the given options.

Snap & solve any problem in the app
Get step-by-step solutions on Sovi AI
Photo-based solutions with guided steps
Explore more problems and detailed explanations
As the depth of the ocean increases, the salinity of the water increases.