QUESTION IMAGE
Question
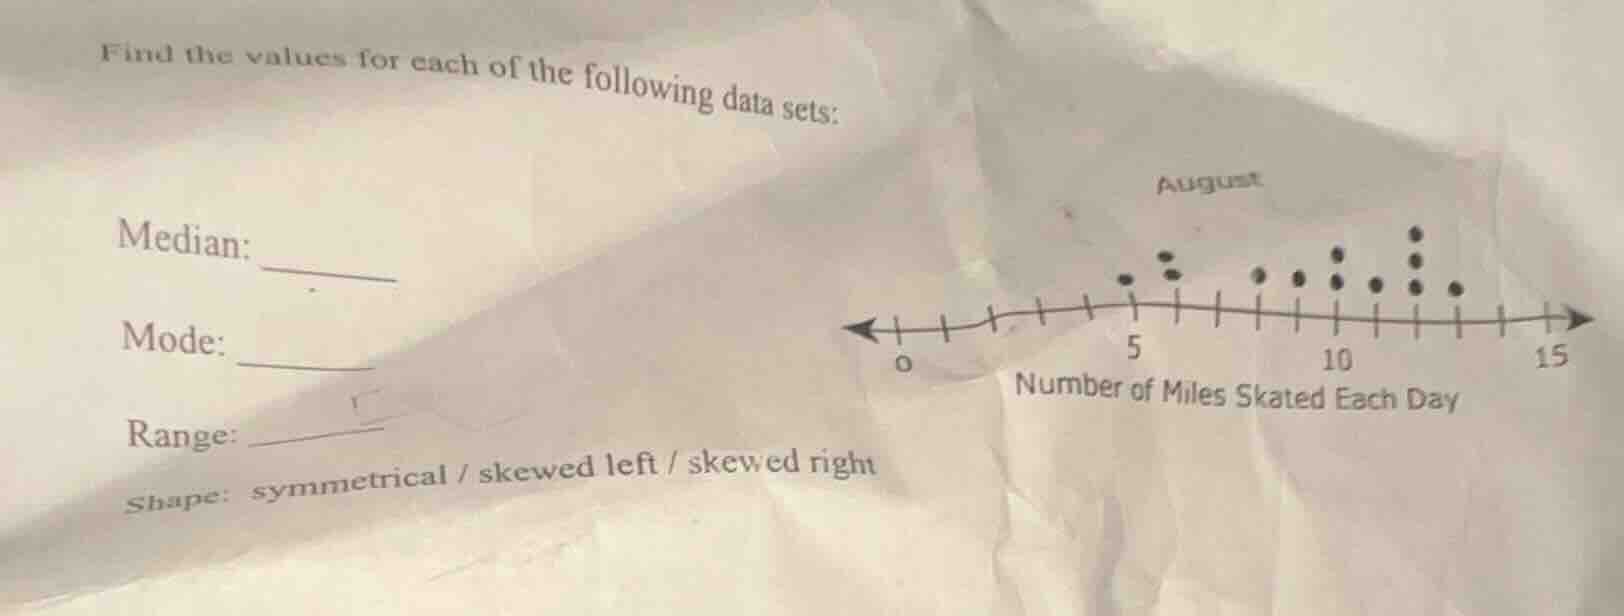
find the values for each of the following data sets:
median: ______
mode: ______
range: ______
shape: symmetrical / skewed left / skewed right
(image: a dot plot labeled august with the x - axis labeled number of miles skated each day ranging from 0 to 15. dots are plotted above the numbers on the x - axis.)
Step1: List all data points
From the dot plot, the data set is: 5, 6, 6, 9, 10, 11, 11, 12, 12, 12, 13, 13, 13, 13, 14
Step2: Calculate the median
There are 15 data points. The median is the 8th value when sorted.
Sorted data: $5, 6, 6, 9, 10, 11, 11, 12, 12, 12, 13, 13, 13, 13, 14$
8th value = $12$
Step3: Identify the mode
The mode is the value that appears most frequently. 13 appears 4 times, more than any other value.
Step4: Calculate the range
Range = Maximum value - Minimum value
$\text{Range} = 14 - 5 = 9$
Step5: Determine the shape
Most data points cluster on the right side, with fewer values on the left. This means the tail extends to the left, so the distribution is skewed left.

Snap & solve any problem in the app
Get step-by-step solutions on Sovi AI
Photo-based solutions with guided steps
Explore more problems and detailed explanations
Median: $12$
Mode: $13$
Range: $9$
Shape: skewed left