QUESTION IMAGE
Question
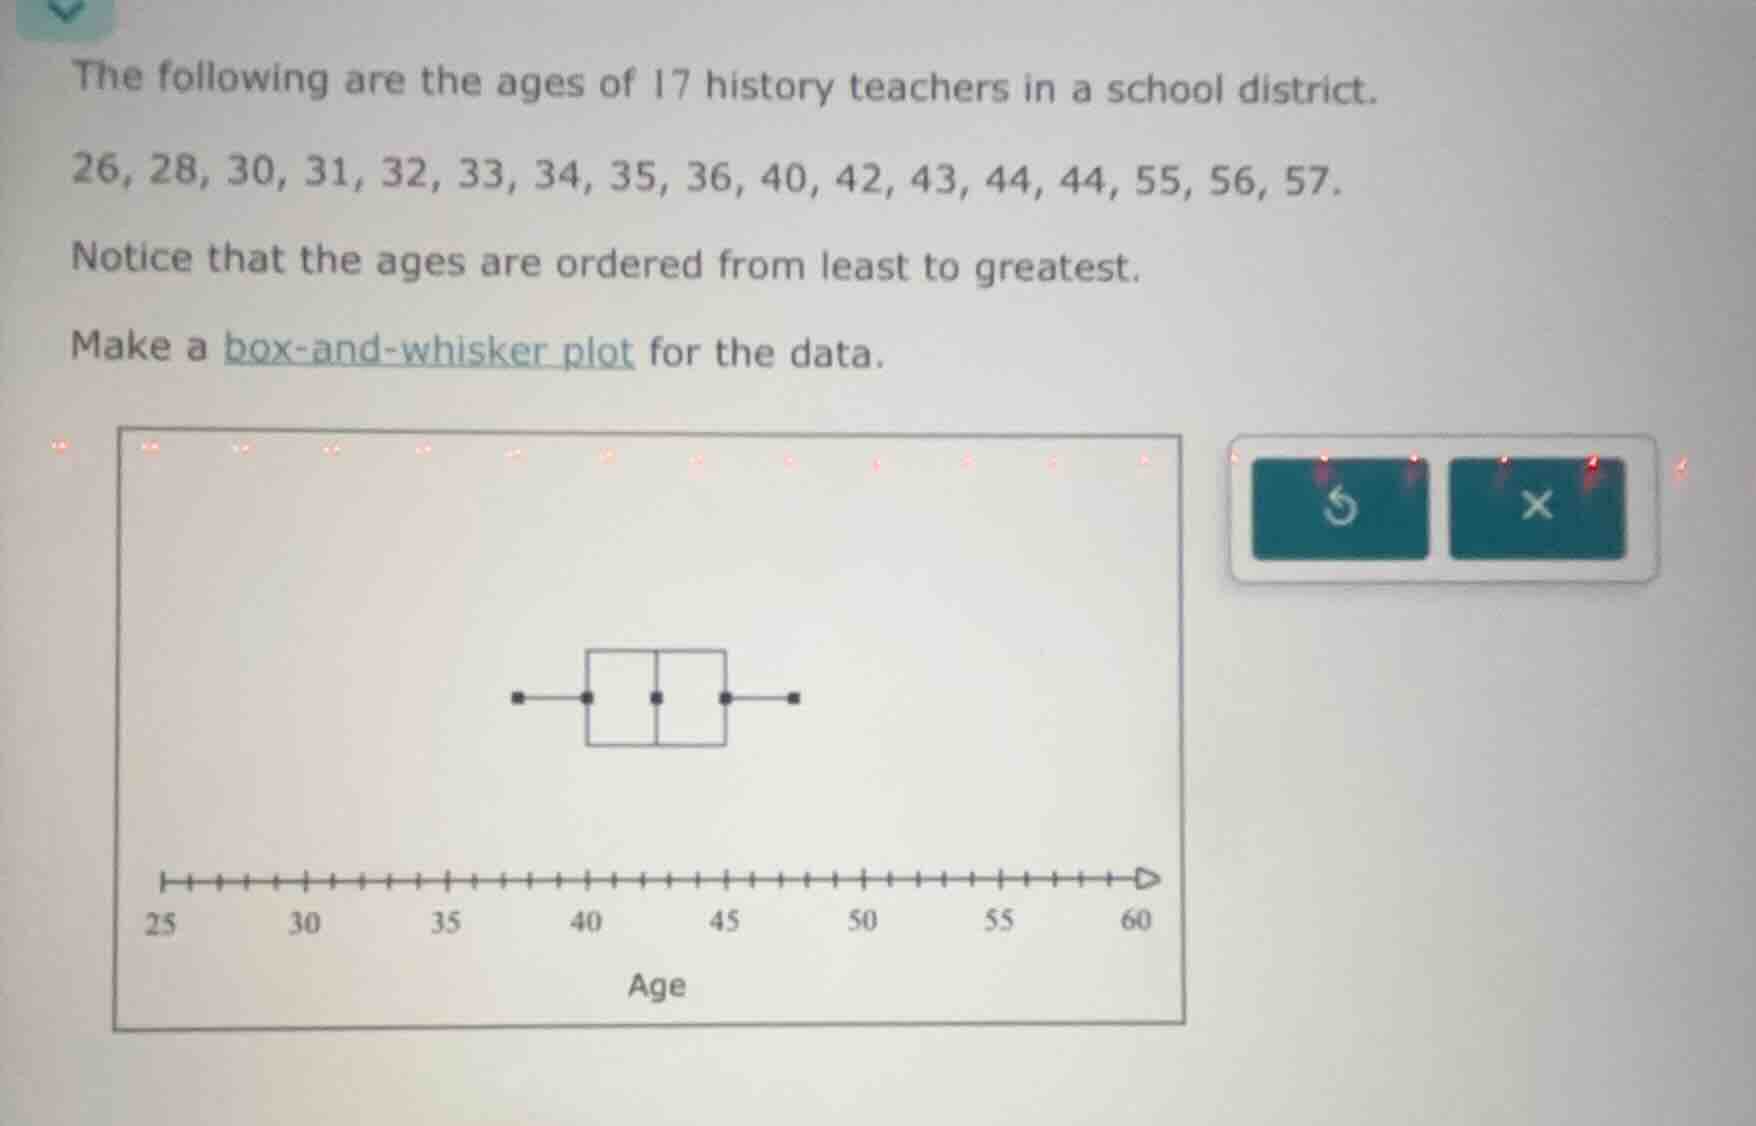
the following are the ages of 17 history teachers in a school district.
26, 28, 30, 31, 32, 33, 34, 35, 36, 40, 42, 43, 44, 44, 55, 56, 57.
notice that the ages are ordered from least to greatest.
make a box - and - whisker plot for the data.
Step1: Find minimum value
Minimum = 26
Step2: Find maximum value
Maximum = 57
Step3: Calculate median (Q2)
Position of median: $\frac{17+1}{2}=9$th value. 9th value = 36
Step4: Calculate Q1 (lower quartile)
Q1 is median of first 8 values: $\frac{31+32}{2}=31.5$
Step5: Calculate Q3 (upper quartile)
Q3 is median of last 8 values: $\frac{44+44}{2}=44$
Step6: Map values to plot
- Left whisker end: 26
- Left box edge: 31.5
- Box middle line: 36
- Right box edge: 44
- Right whisker end: 57

Snap & solve any problem in the app
Get step-by-step solutions on Sovi AI
Photo-based solutions with guided steps
Explore more problems and detailed explanations
The box-and-whisker plot has:
- Left whisker at 26, left box boundary at 31.5, median line at 36, right box boundary at 44, right whisker at 57, aligned to the age axis (25-60).