QUESTION IMAGE
Question
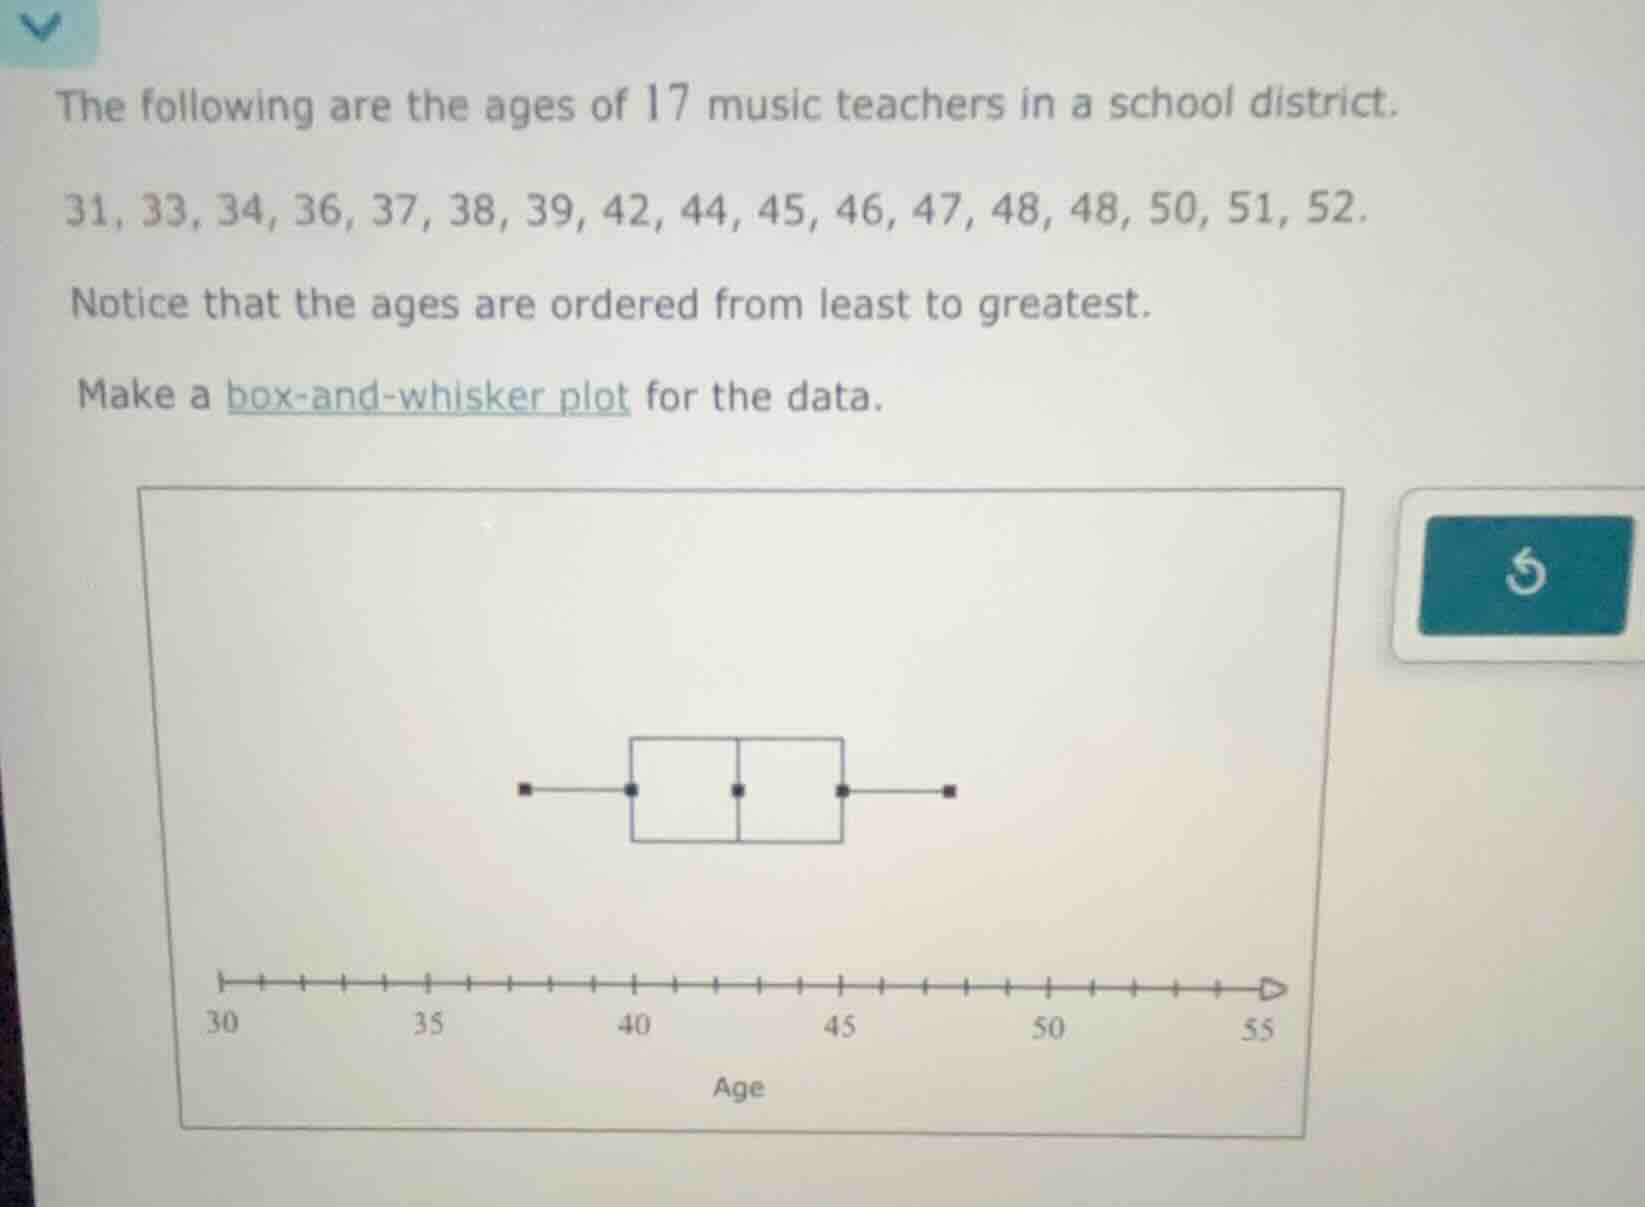
the following are the ages of 17 music teachers in a school district. 31, 33, 34, 36, 37, 38, 39, 42, 44, 45, 46, 47, 48, 48, 50, 51, 52. notice that the ages are ordered from least to greatest. make a box-and-whisker plot for the data.
Step1: Find the minimum value
The smallest data point is 31.
Step2: Find the first quartile (Q1)
For $n=17$, position of Q1 is $\frac{17+1}{4}=4.5$, so average 4th & 5th values:
$\frac{36+37}{2}=36.5$
Step3: Find the median (Q2)
Position of median is $\frac{17+1}{2}=9$, so 9th value: 44
Step4: Find the third quartile (Q3)
Position of Q3 is $3\times\frac{17+1}{4}=13.5$, so average 13th & 14th values:
$\frac{48+48}{2}=48$
Step5: Find the maximum value
The largest data point is 52.
Step6: Map values to the plot
Align min=31, Q1=36.5, median=44, Q3=48, max=52 to the age axis (30-55), then draw the box-and-whisker plot:
- Left whisker from 31 to Q1=36.5
- Box from Q1=36.5 to Q3=48, with a line at median=44
- Right whisker from Q3=48 to 52

Snap & solve any problem in the app
Get step-by-step solutions on Sovi AI
Photo-based solutions with guided steps
Explore more problems and detailed explanations
The box-and-whisker plot is constructed with:
- Minimum value at 31,
- First quartile (Q1) at 36.5,
- Median (Q2) at 44,
- Third quartile (Q3) at 48,
- Maximum value at 52,
aligned to the provided age axis (30 to 55) as described in the steps.