QUESTION IMAGE
Question
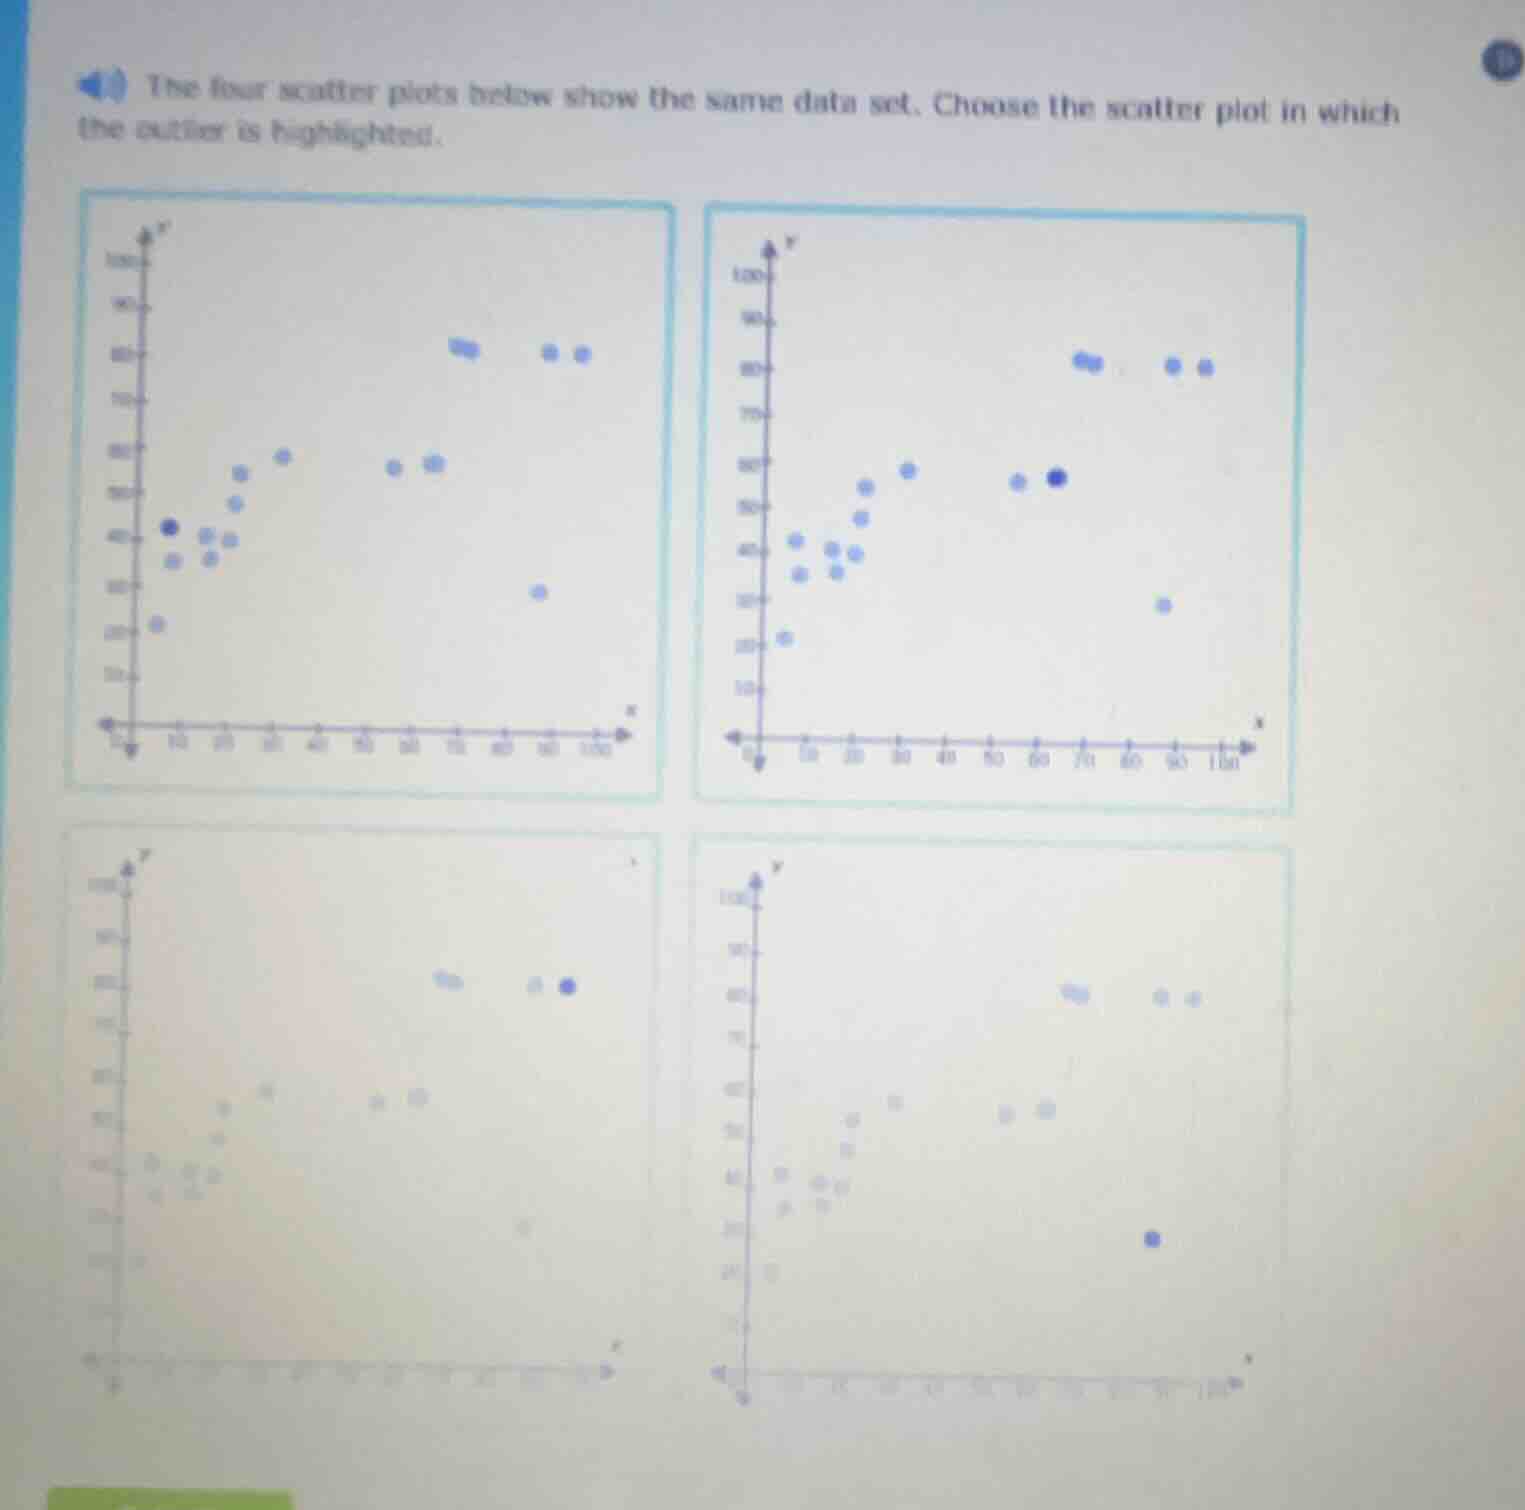
the four scatter plots below show the same data set. choose the scatter plot in which the outlier is highlighted.
An outlier is a data point that lies far outside the general cluster of other data points. Looking at the scatter plots, the bottom-right plot highlights the point at (90, ~25), which is separated from the main group of points (most points are clustered with higher y-values or lower x-values, while this point is isolated in the lower right, far from the rest of the data). The other plots highlight points that are within or close to the main data cluster, so they are not true outliers.

Snap & solve any problem in the app
Get step-by-step solutions on Sovi AI
Photo-based solutions with guided steps
Explore more problems and detailed explanations
The bottom-right scatter plot (the fourth one, with the highlighted point at the lower right, far from the main data cluster)