QUESTION IMAGE
Question
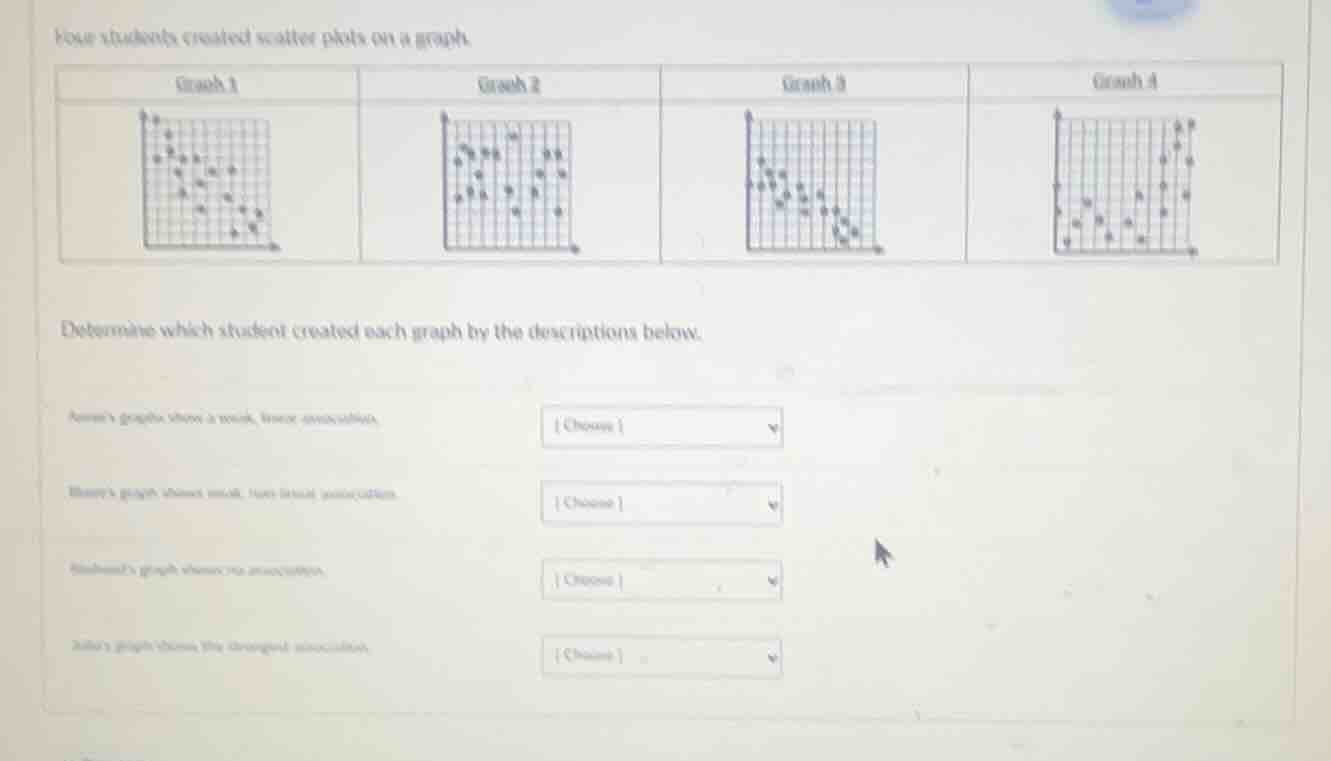
four students created scatter plots on a graph.
graph 1\tgraph 2\tgraph 3\tgraph 4
images of four scatter plots
determine which student created each graph by the descriptions below.
kevin’s graph shows a weak, linear association.\tchoose
barry’s graph shows weak, non - linear association.\tchoose
michael’s graph shows no association.\tchoose
julie’s graph shows the strongest association.\tchoose
To solve this, we analyze the scatter plots based on association types:
1. Annie’s graph (weak, linear association)
A weak linear association has points loosely following a line. Graph 4’s points show a slight upward trend but are spread out, so Annie → Graph 4.
2. Henry’s graph (weak, non - linear association)
A weak non - linear association has points with no clear linear trend. Graph 1’s points form a curve (not a straight line) and are spread, so Henry → Graph 1.
3. Michael’s graph (no association)
No association means points are randomly scattered. Graph 2’s points have no clear trend, so Michael → Graph 2.
4. Julie’s graph (strong, negative association)
A strong negative association has points closely following a downward - sloping line. Graph 3’s points are tightly clustered along a negative slope, so Julie → Graph 3.

Snap & solve any problem in the app
Get step-by-step solutions on Sovi AI
Photo-based solutions with guided steps
Explore more problems and detailed explanations
s:
- Annie: Graph 4
- Henry: Graph 1
- Michael: Graph 2
- Julie: Graph 3