QUESTION IMAGE
Question
friday, 1/16
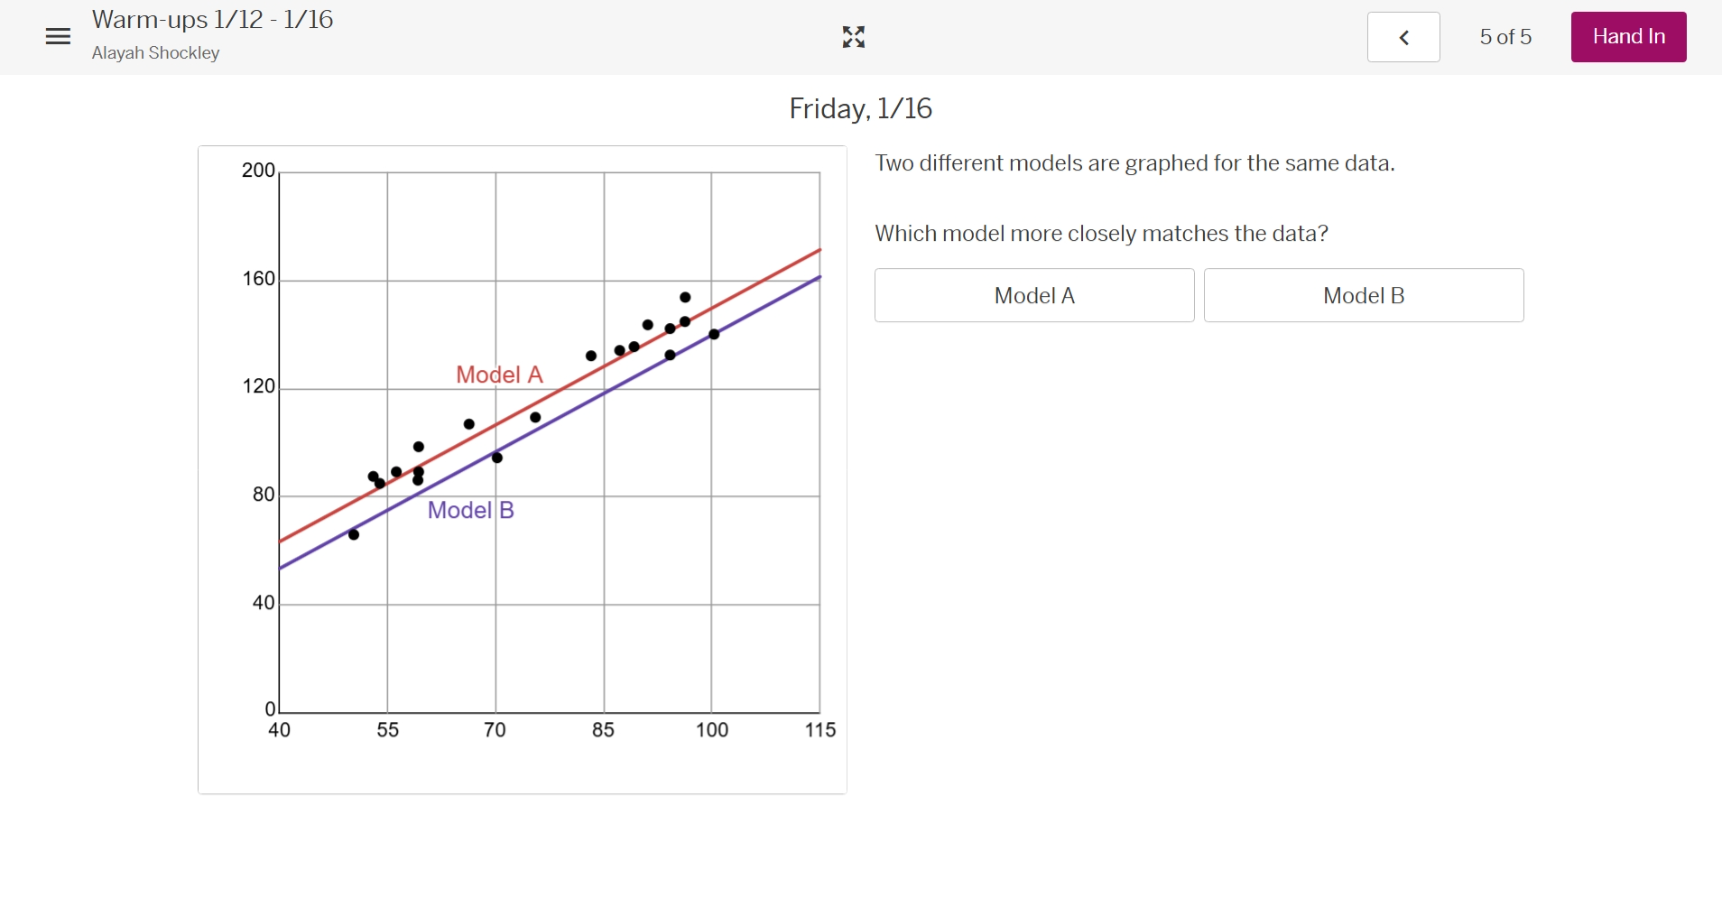
two different models are graphed for the same data.
which model more closely matches the data?
model a
model b
Brief Explanations
To determine which model more closely matches the data, we observe the distance between the data points (black dots) and each model's line. Model A's line is closer to most of the data points, especially in the lower - value range (around x = 40 - 70) and also in the higher - value range (around x = 85 - 100). Model B's line is further away from some of the data points, like the point around x = 55. So, Model A is a better fit.

Snap & solve any problem in the app
Get step-by-step solutions on Sovi AI
Photo-based solutions with guided steps
Explore more problems and detailed explanations
Model A