QUESTION IMAGE
Question
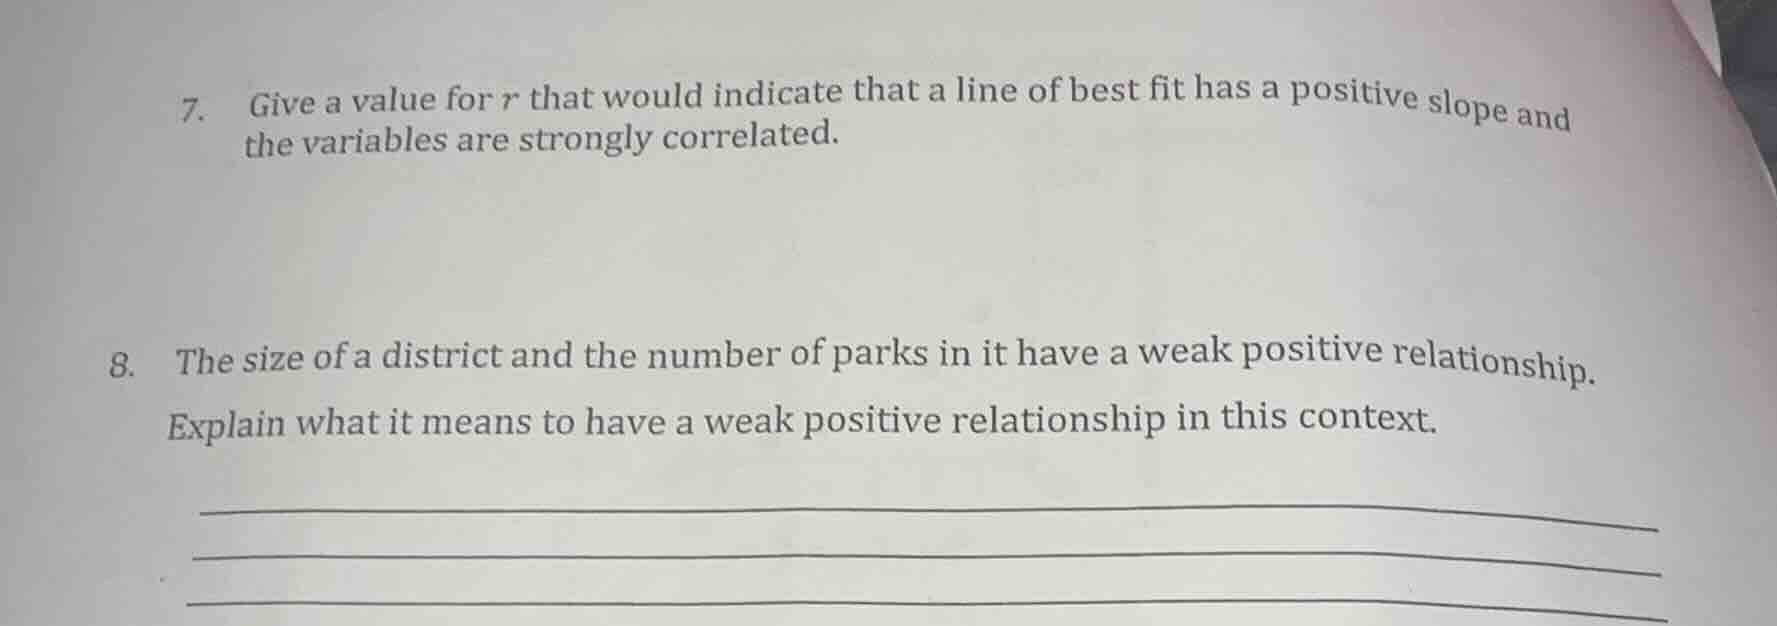
- give a value for r that would indicate that a line of best fit has a positive slope and the variables are strongly correlated.
- the size of a district and the number of parks in it have a weak positive relationship.
explain what it means to have a weak positive relationship in this context.
Step1: Define strong positive r range
The correlation coefficient $r$ ranges from $-1$ to $1$. A strong positive correlation corresponds to $r$ values close to $1$, typically $0.7 < r \leq 1$.
Step2: Select valid r value
Choose a value within this range, e.g., $r = 0.85$.
For the weak positive relationship: A weak positive relationship means that as the size of a district increases, the number of parks in it tends to increase, but this trend is not consistent or strong. There is a loose, not tight, upward pattern when plotting district size against number of parks, and many data points will deviate from a clear upward line.

Snap & solve any problem in the app
Get step-by-step solutions on Sovi AI
Photo-based solutions with guided steps
Explore more problems and detailed explanations
- $r = 0.85$ (any value between 0.7 and 1 is acceptable)
- As district size increases, the number of parks tends to increase, but the trend is not strong, with many data points deviating from a clear upward pattern.