QUESTION IMAGE
Question
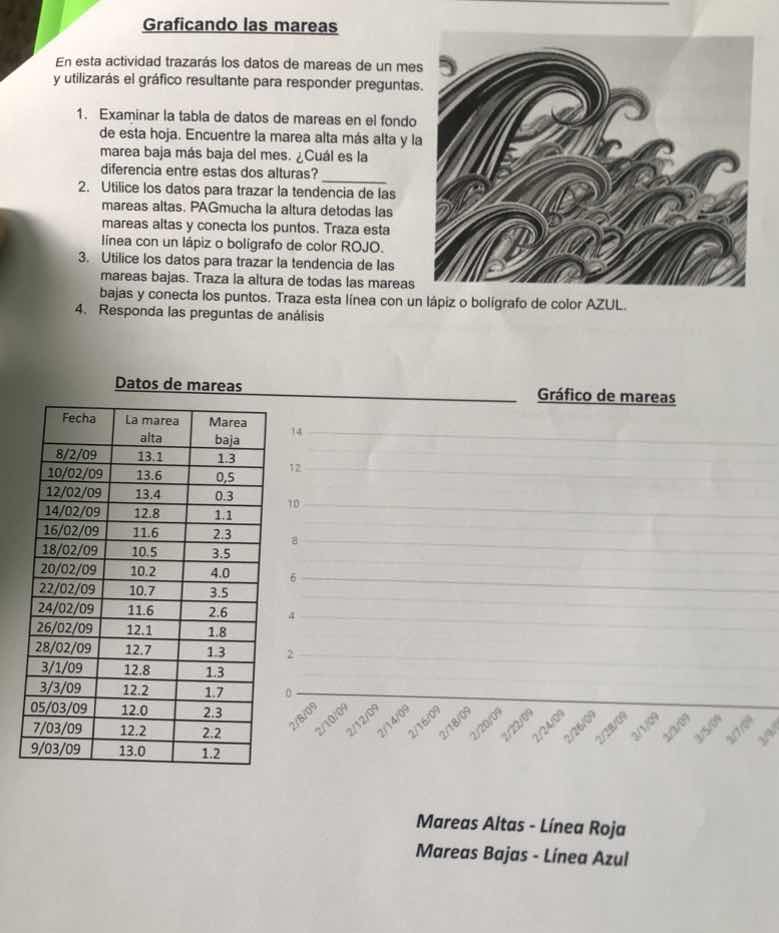
graficando las mareas
en esta actividad trazarás los datos de mareas de un mes
y utilizarás el gráfico resultante para responder preguntas.
- examinar la tabla de datos de mareas en el fondo
de esta hoja. encuentre la marea alta más alta y la
marea baja más baja del mes. ¿cuál es la
diferencia entre estas dos alturas? ______
- utilice los datos para trazar la tendencia de las
mareas altas. pagnucha la altura de todas las
mareas altas y conecta los puntos. traza esta
línea con un lápiz de color rojo.
- utilice los datos para trazar la tendencia de las mareas
bajas y conecta los puntos. traza esta línea con un lápiz o bolígrafo de color azul.
- responda las preguntas de análisis
datos de mareas
gráfico de mareas
fecha
la marea
alta
marea
baja
8/2/09
13.1
1.3
10/02/09
13.6
0.5
12/02/09
13.4
0.3
14/02/09
12.8
1.1
16/02/09
11.6
2.3
18/02/09
10.5
3.5
20/02/09
10.2
4.0
22/02/09
10.7
3.5
24/02/09
11.6
2.6
26/02/09
12.1
1.8
28/02/09
12.7
1.3
3/1/09
12.8
1.3
3/3/09
12.2
1.7
05/03/09
12.0
2.3
7/03/09
12.2
2.2
9/03/09
13.0
1.2
mareas altas - línea roja
mareas bajas - línea azul
To solve the first question (finding the highest high tide, lowest low tide, and their difference), we analyze the data:
Step 1: Find the highest high tide
Look at the "Marea alta" (high tide) column:
- Values: 13.1, 13.6, 13.4, 12.8, 11.6, 10.5, 10.2, 10.7, 11.6, 12.1, 12.7, 12.8, 12.2, 12.0, 13.0
- The highest value is \( 13.6 \).
Step 2: Find the lowest low tide
Look at the "Marea baja" (low tide) column:
- Values: 1.3, 0.5, 0.3, 1.1, 2.3, 3.5, 4.0, 3.5, 2.6, 1.8, 1.3, 1.3, 1.7, 2.3, 1.2
- The lowest value is \( 0.3 \).
Step 3: Calculate the difference
Subtract the lowest low tide from the highest high tide:
\( 13.6 - 0.3 = 13.3 \).

Snap & solve any problem in the app
Get step-by-step solutions on Sovi AI
Photo-based solutions with guided steps
Explore more problems and detailed explanations
The highest high tide is \( 13.6 \), the lowest low tide is \( 0.3 \), and their difference is \( \boldsymbol{13.3} \).