QUESTION IMAGE
Question
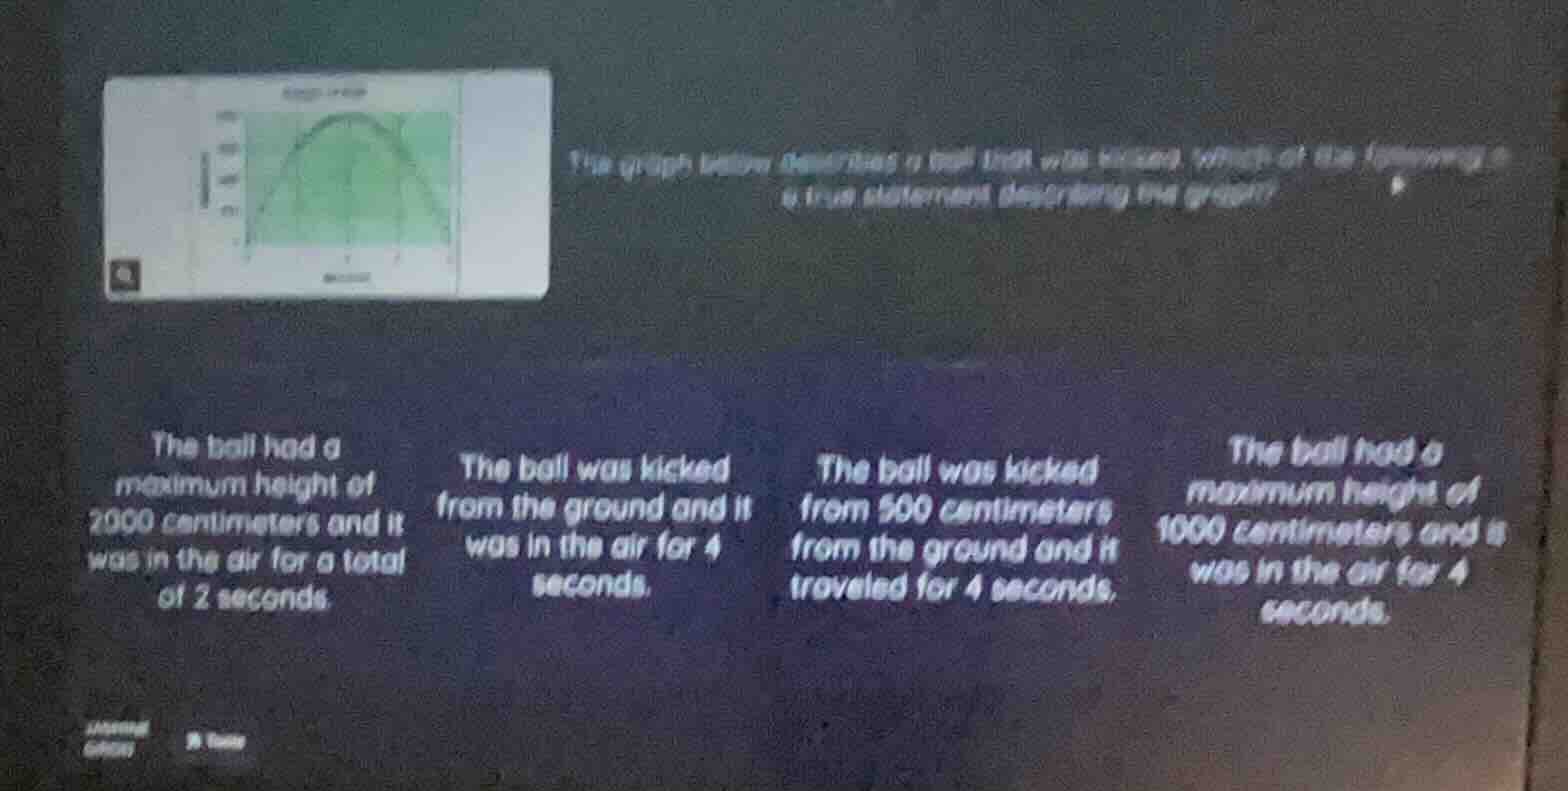
the graph below describes a ball that was kicked. which of the following is a true statement describing the graph?
the ball had a maximum height of 2000 centimeters and it was in the air for a total of 2 seconds.
the ball was kicked from the ground and it was in the air for 4 seconds.
the ball was kicked from 500 centimeters from the ground and it traveled for 4 seconds.
the ball had a maximum height of 1000 centimeters and is was in the air for 4 seconds.
Brief Explanations
- Analyze the graph's y-axis (height): The peak of the curve reaches 1000 centimeters, so this is the maximum height.
- Analyze the graph's x-axis (time): The curve starts at x=0 (kickoff) and ends at x=4 (when the ball returns to the ground), so total time in air is 4 seconds.
- Match to options: The ball starts at x=0, y=0, meaning it was kicked from ground level.

Snap & solve any problem in the app
Get step-by-step solutions on Sovi AI
Photo-based solutions with guided steps
Explore more problems and detailed explanations
D. The ball had a maximum height of 1000 centimeters and it was in the air for 4 seconds.