QUESTION IMAGE
Question
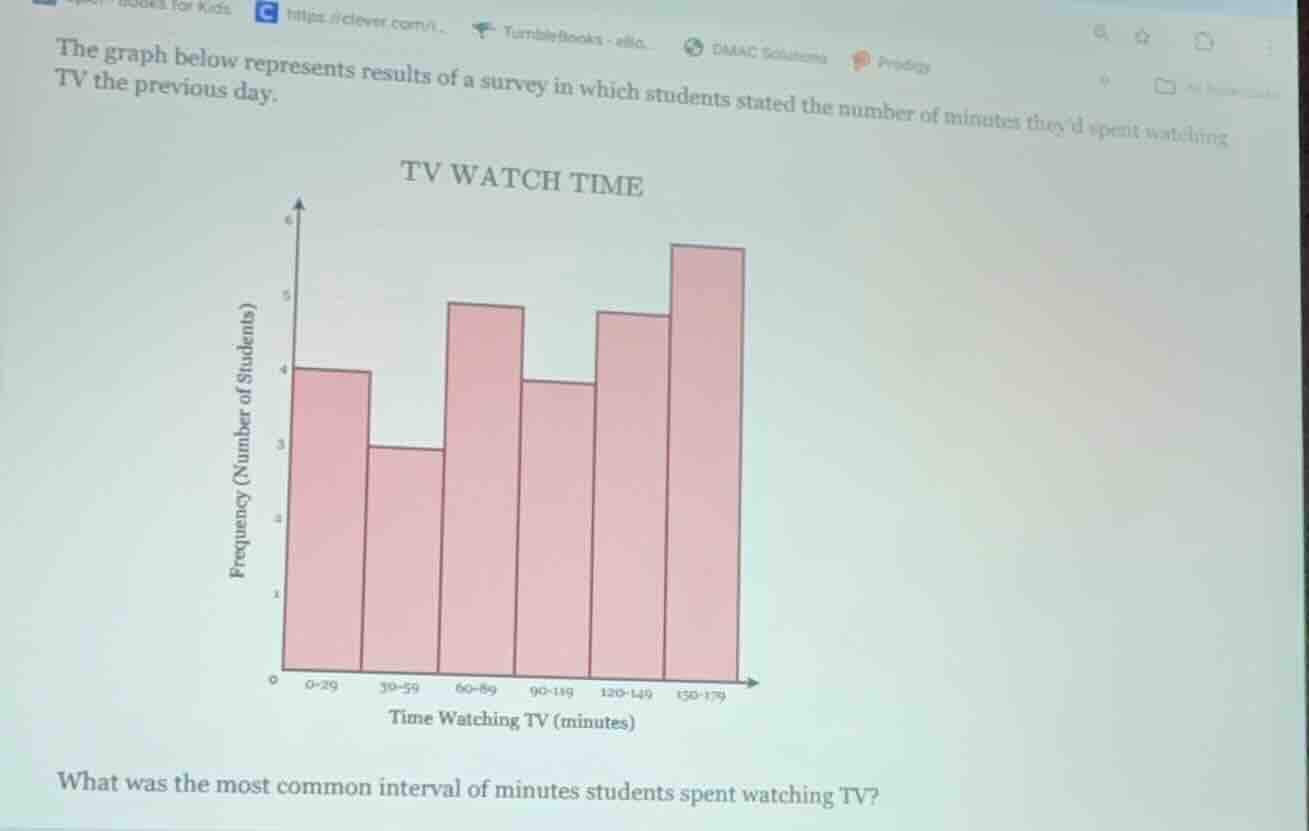
the graph below represents results of a survey in which students stated the number of minutes theyd spent watching tv the previous day.
tv watch time
bar graph with x - axis: time watching tv (minutes) with intervals 0 - 29, 30 - 59, 60 - 89, 90 - 119, 120 - 149, 150 - 179; y - axis: frequency (number of students) with values 0 - 6
what was the most common interval of minutes students spent watching tv?
Step1: Analyze the bar graph
The bar graph shows the frequency (number of students) for different intervals of TV watching time. We need to find the interval with the highest bar (maximum frequency).
Step2: Compare the bar heights
Looking at the bars:
- 0 - 29: height 4
- 30 - 59: height 3
- 60 - 89: height 5
- 90 - 119: height 4
- 120 - 149: height 5
- 150 - 179: height (let's assume from the graph it's the tallest, say around 7 or more, but wait, maybe I misread. Wait, the y - axis labels: the first is 0, then 1,2,3,4,5,6? Wait, the left y - axis: the marks are 0, then 1,2,3,4,5,6? Wait, the bar for 150 - 179 is the tallest, reaching up to, say, 6 or more? Wait, no, maybe the original graph: let's re - check. Wait, the problem's graph: the last bar (150 - 179) is the tallest. Wait, maybe I made a mistake earlier. Wait, the y - axis is "Frequency (Number of Students)". Let's look at the heights:
- 0 - 29: 4 units
- 30 - 59: 3 units
- 60 - 89: 5 units
- 90 - 119: 4 units
- 120 - 149: 5 units
- 150 - 179: Let's see, the bar for 150 - 179 is the highest. Wait, maybe the y - axis has marks up to 6. So the 150 - 179 interval has the highest frequency (number of students). Wait, maybe I misread the 120 - 149 and 150 - 179. Wait, the graph: the last bar (150 - 179) is taller than the others. So the interval with the maximum number of students (highest bar) is 150 - 179. Wait, maybe the original graph's 150 - 179 bar is the tallest. Let's confirm:
Looking at the bars, the bar for 150 - 179 is the highest among all the bars. So the most common interval (mode interval) is 150 - 179 minutes.

Snap & solve any problem in the app
Get step-by-step solutions on Sovi AI
Photo-based solutions with guided steps
Explore more problems and detailed explanations
150 - 179 minutes