QUESTION IMAGE
Question
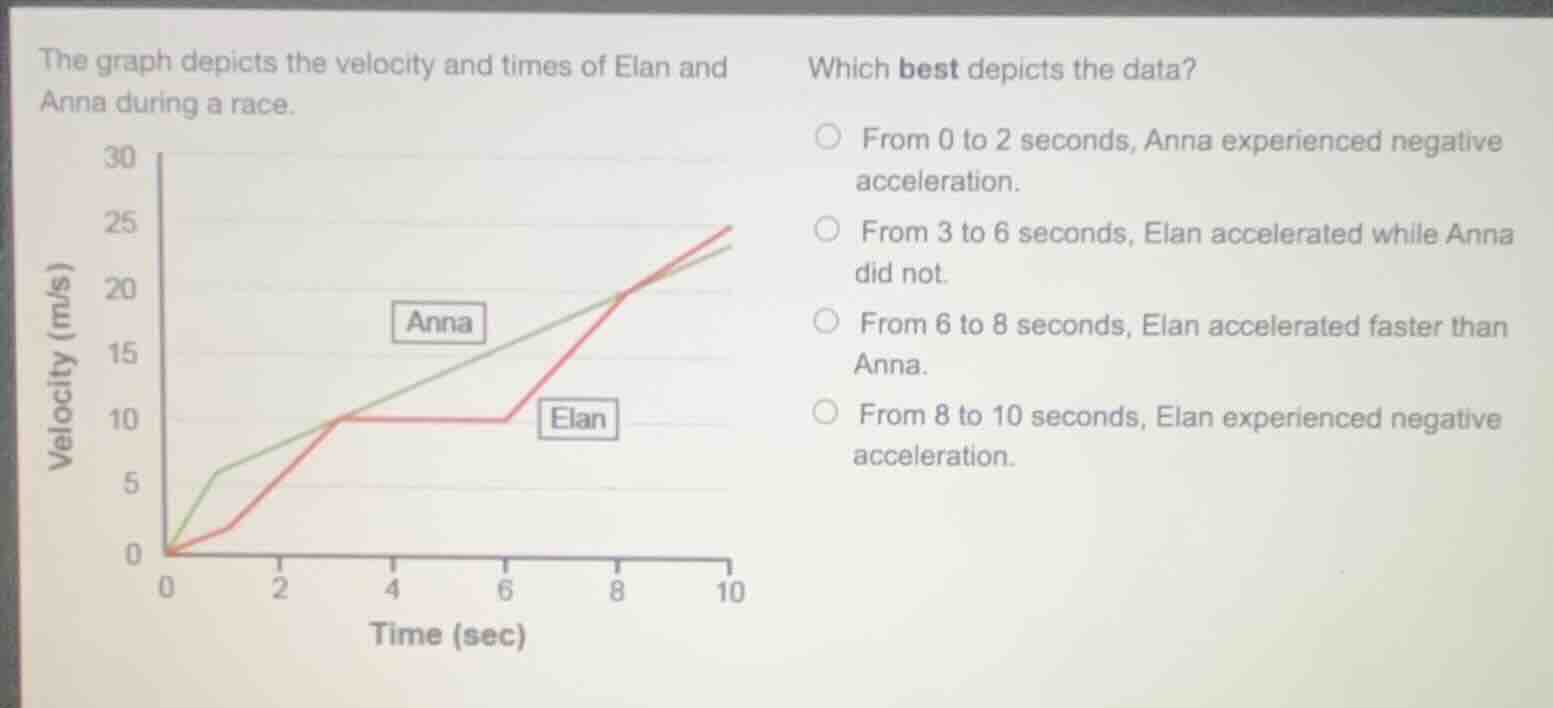
the graph depicts the velocity and times of elan and anna during a race. which best depicts the data? from 0 to 2 seconds, anna experienced negative acceleration. from 3 to 6 seconds, elan accelerated while anna did not. from 6 to 8 seconds, elan accelerated faster than anna. from 8 to 10 seconds, elan experienced negative acceleration.
Brief Explanations
- Analyze option 1: From 0 to 2 seconds, Anna's velocity is increasing (positive slope), so acceleration is positive, not negative. Eliminate this.
- Analyze option 2: From 3 to 6 seconds, Elan's velocity is constant (flat line), so no acceleration; Anna's velocity is increasing (positive slope), so she is accelerating. Eliminate this.
- Analyze option 3: From 6 to 8 seconds, compare the slopes (acceleration) of Elan and Anna. Elan's slope (change in velocity over time) is steeper than Anna's, meaning Elan accelerated faster. This is correct.
- Analyze option 4: From 8 to 10 seconds, Elan's velocity is increasing (positive slope), so acceleration is positive, not negative. Eliminate this.

Snap & solve any problem in the app
Get step-by-step solutions on Sovi AI
Photo-based solutions with guided steps
Explore more problems and detailed explanations
From 6 to 8 seconds, Elan accelerated faster than Anna.