QUESTION IMAGE
Question
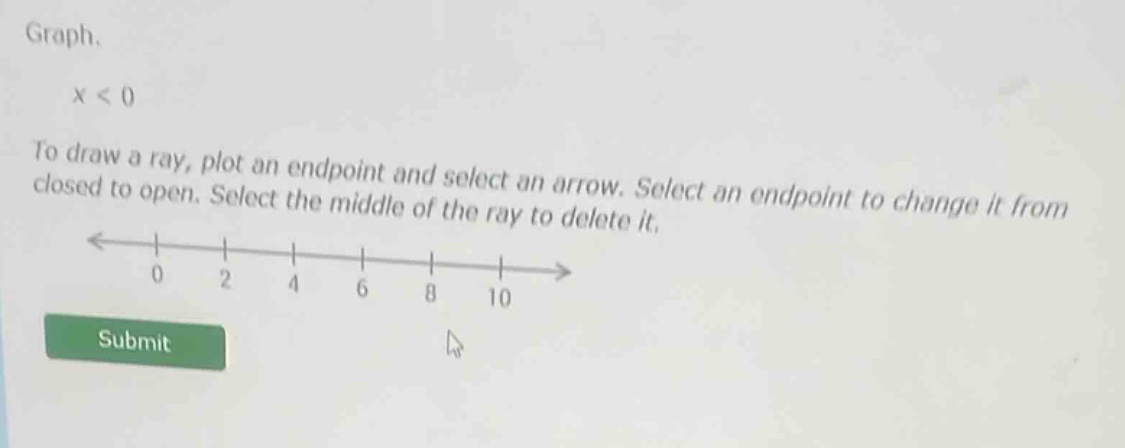
graph.
x < 0
to draw a ray, plot an endpoint and select an arrow. select an endpoint to change it from closed to open. select the middle of the ray to delete it.
submit
Step1: Analyze the inequality
The inequality is \( x < 0 \). This means we need to represent all real numbers less than 0 on the number line.
Step2: Determine the endpoint type
Since the inequality is strict (\( < \), not \( \leq \)), the endpoint at 0 should be an open circle (not filled in) to indicate that 0 is not included in the solution set.
Step3: Draw the ray
From the open circle at 0, we draw a ray to the left (towards negative infinity) because we want all numbers less than 0.

Snap & solve any problem in the app
Get step-by-step solutions on Sovi AI
Photo-based solutions with guided steps
Explore more problems and detailed explanations
To graph \( x < 0 \):
- Place an open circle at \( x = 0 \) on the number line (since 0 is not included in the solution).
- Draw a ray starting from the open circle at 0 and extending to the left (towards smaller numbers) to represent all numbers less than 0.