QUESTION IMAGE
Question
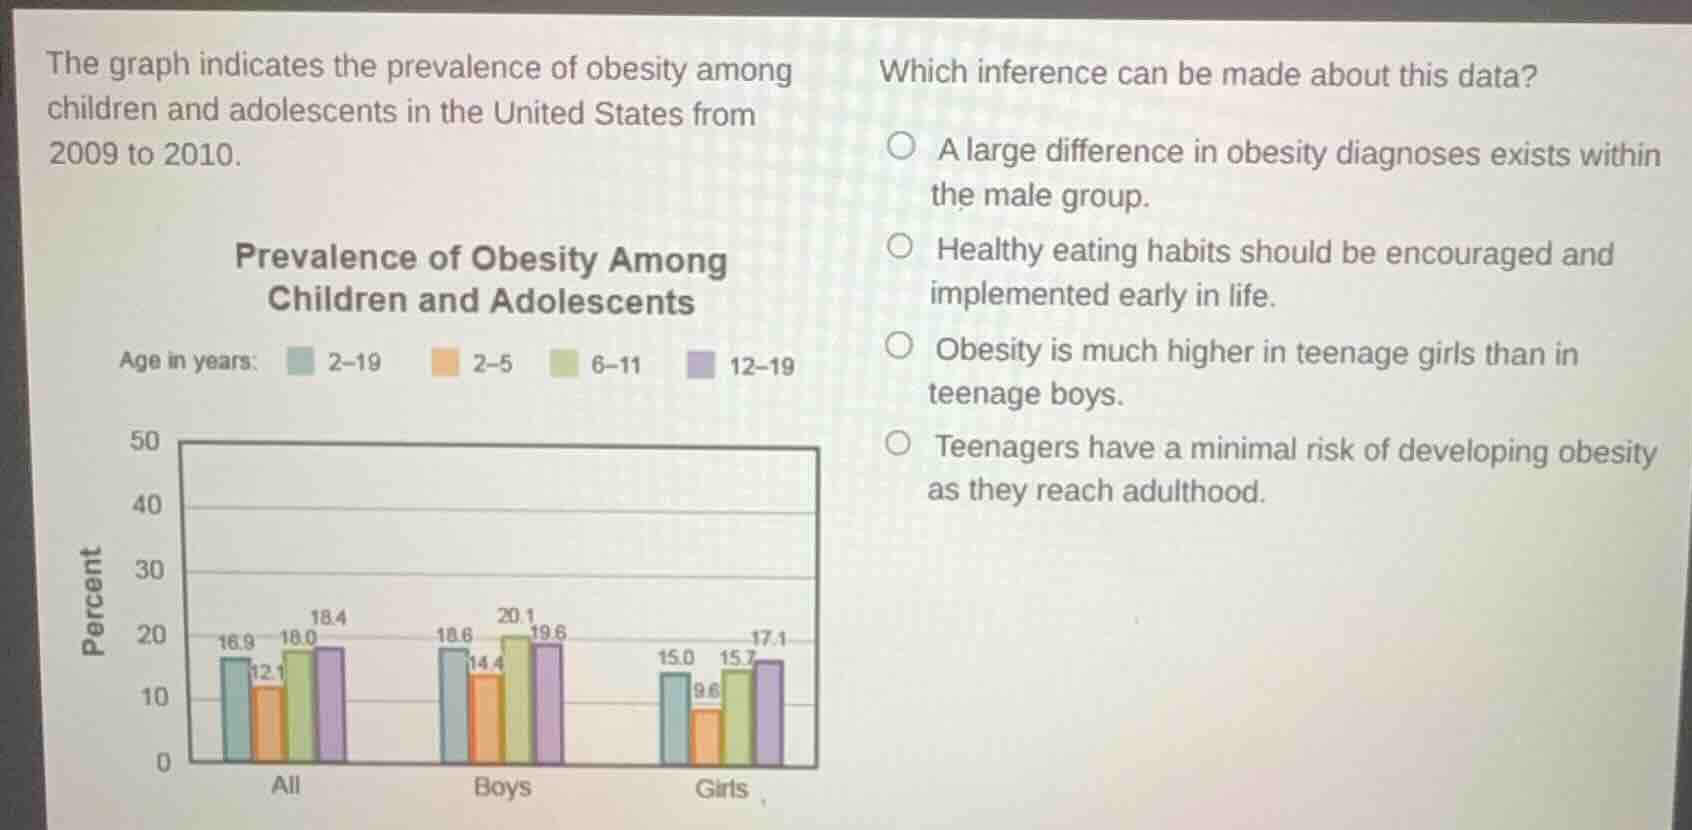
the graph indicates the prevalence of obesity among children and adolescents in the united states from 2009 to 2010.
prevalence of obesity among
children and adolescents
age in years: 2–19 2–5 6–11 12–19
which inference can be made about this data?
a large difference in obesity diagnoses exists within the male group.
healthy eating habits should be encouraged and implemented early in life.
obesity is much higher in teenage girls than in teenage boys.
teenagers have a minimal risk of developing obesity as they reach adulthood.
- For option A: The male group (Boys) has obesity percentages (18.6, 14.4, 20.1, 19.6) with smaller differences (e.g., 18.6 - 14.4 = 4.2, 20.1 - 18.6 = 1.5), so no large difference. Eliminate A.
- For option B: The graph shows obesity prevalence in children/adolescents, so encouraging healthy eating early (to prevent obesity) is a valid inference.
- For option C: Teenage girls (12 - 19: 17.1) vs teenage boys (12 - 19: 19.6) – boys have higher obesity, so C is wrong.
- For option D: Teenagers (12 - 19) have significant obesity (17.1 - 19.6%), so "minimal risk" is wrong. Eliminate D.

Snap & solve any problem in the app
Get step-by-step solutions on Sovi AI
Photo-based solutions with guided steps
Explore more problems and detailed explanations
B. Healthy eating habits should be encouraged and implemented early in life.