QUESTION IMAGE
Question
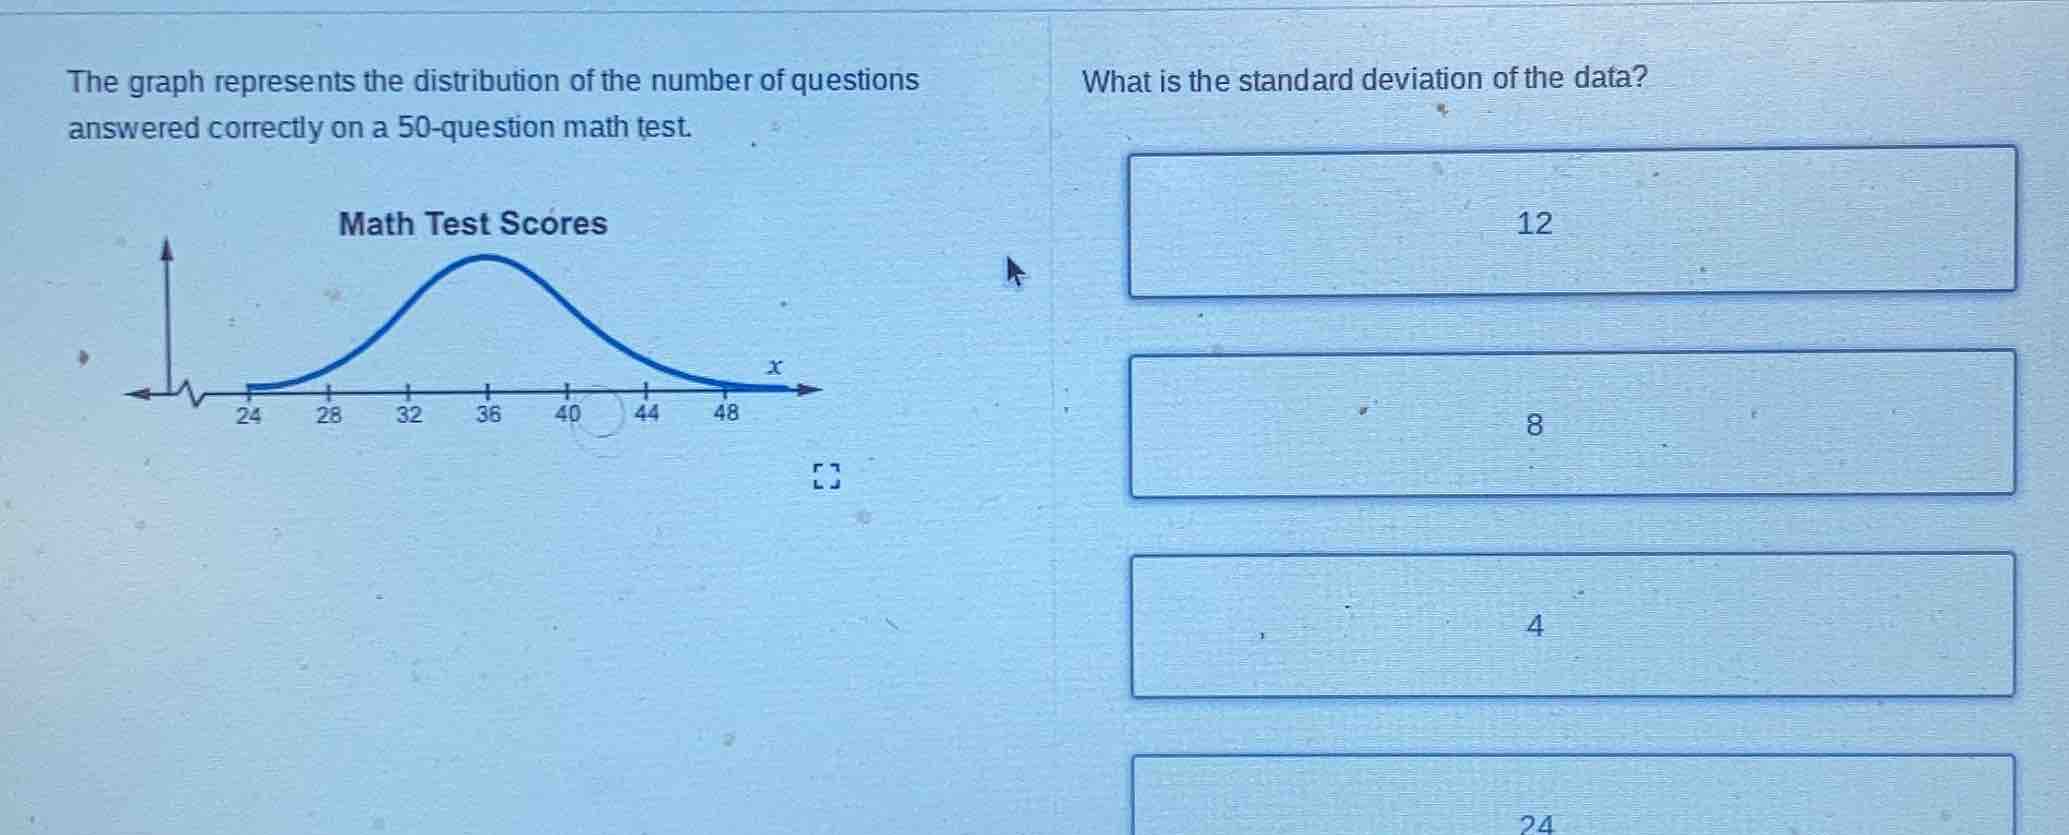
the graph represents the distribution of the number of questions answered correctly on a 50 - question math test. math test scores (the graph is a curve starting from 24, with x - axis marks at 24, 28, 32, 36, 40, 44, 48) what is the standard deviation of the data? options: 12, 8, 4, 24
Step1: Analyze the normal distribution graph
The graph is a normal distribution curve for math test scores. The horizontal axis has marks at 24, 28, 32, 36, 40, 44, 48. The distance between key points (like from the mean to a point) can help find standard deviation.
Step2: Determine the spread
Looking at the x - axis, the distance between 36 (approximate mean) and 44, or 28 and 36, etc. The standard deviation is a measure of spread. From the graph, the distance between consecutive key points (like 36 to 40 is 4, 40 to 44 is 4, etc.) suggests the standard deviation is 4? Wait, no, wait. Wait, in a normal distribution, the standard deviation can be estimated by the spread. Wait, the marks are at 24,28,32,36,40,44,48. The difference between 36 and 44 is 8? No, 36 to 40 is 4, 40 to 44 is 4, so each interval is 4? Wait, no, 24 to 28 is 4, 28 to 32 is 4, etc. So the standard deviation is 4? Wait, no, maybe I made a mistake. Wait, the options are 12,8,4,24. Let's think again. The mean is around 36. The distance from mean to 44 is 8? 36 to 44 is 8. Wait, no, 36 + 8 = 44, 36 - 8 = 28. So the standard deviation is 8? Wait, no, 24 is too big, 12 is too big, 24 is the minimum value. Wait, the graph's x - axis: 24,28,32,36,40,44,48. So the distance between 36 and 44 is 8, 36 and 28 is 8. So the standard deviation is 8? Wait, no, maybe the standard deviation is 4? Wait, no, let's check the options. The options are 12,8,4,24. Let's see: the data is centered around 36. The spread from 24 to 48 is 24, but standard deviation is not that. Wait, the difference between 36 and 44 is 8, 36 and 28 is 8. So the standard deviation is 8? Wait, no, maybe I messed up. Wait, in a normal distribution, the standard deviation is the average distance from the mean. If the marks are at intervals of 4, but the standard deviation is 4? Wait, no, the options: 4 is an option. Wait, maybe the standard deviation is 4. Wait, no, let's think again. The graph shows the distribution of test scores (50 - question test, so scores from 24 to 48). The standard deviation is a measure of how spread out the data is. The options are 4,8,12,24. 24 is the minimum value, so not. 12 would make the spread too big. 8: from mean (36) to 44 is 8, to 28 is 8. 4: from 36 to 40 is 4. Wait, maybe the correct answer is 4? No, wait, maybe I made a mistake. Wait, let's check the intervals. The x - axis has ticks at 24,28,32,36,40,44,48. The difference between each tick is 4. So the standard deviation is 4? But 8 is also an option. Wait, maybe the standard deviation is 4. Wait, no, let's recall that in a normal distribution, about 68% of data is within 1 standard deviation of mean, 95% within 2, 99.7% within 3. If the mean is 36, and 68% of data is between 36 - s and 36 + s. If s = 4, then 32 to 40. If s = 8, then 28 to 44. Looking at the graph, the curve is from 24 to 48, but the peak is around 36. The spread from 28 to 44 seems more reasonable for 1 standard deviation? Wait, no, 28 to 44 is 16, which is 2 standard deviations (if s = 8, then 2s = 16). Wait, maybe the standard deviation is 4. Wait, I'm confused. Wait, the options are 4,8,12,24. Let's see the difference between 36 and 40 is 4, 40 and 44 is 4, so each "step" is 4. So the standard deviation is 4. So the answer is 4.

Snap & solve any problem in the app
Get step-by-step solutions on Sovi AI
Photo-based solutions with guided steps
Explore more problems and detailed explanations
4