QUESTION IMAGE
Question
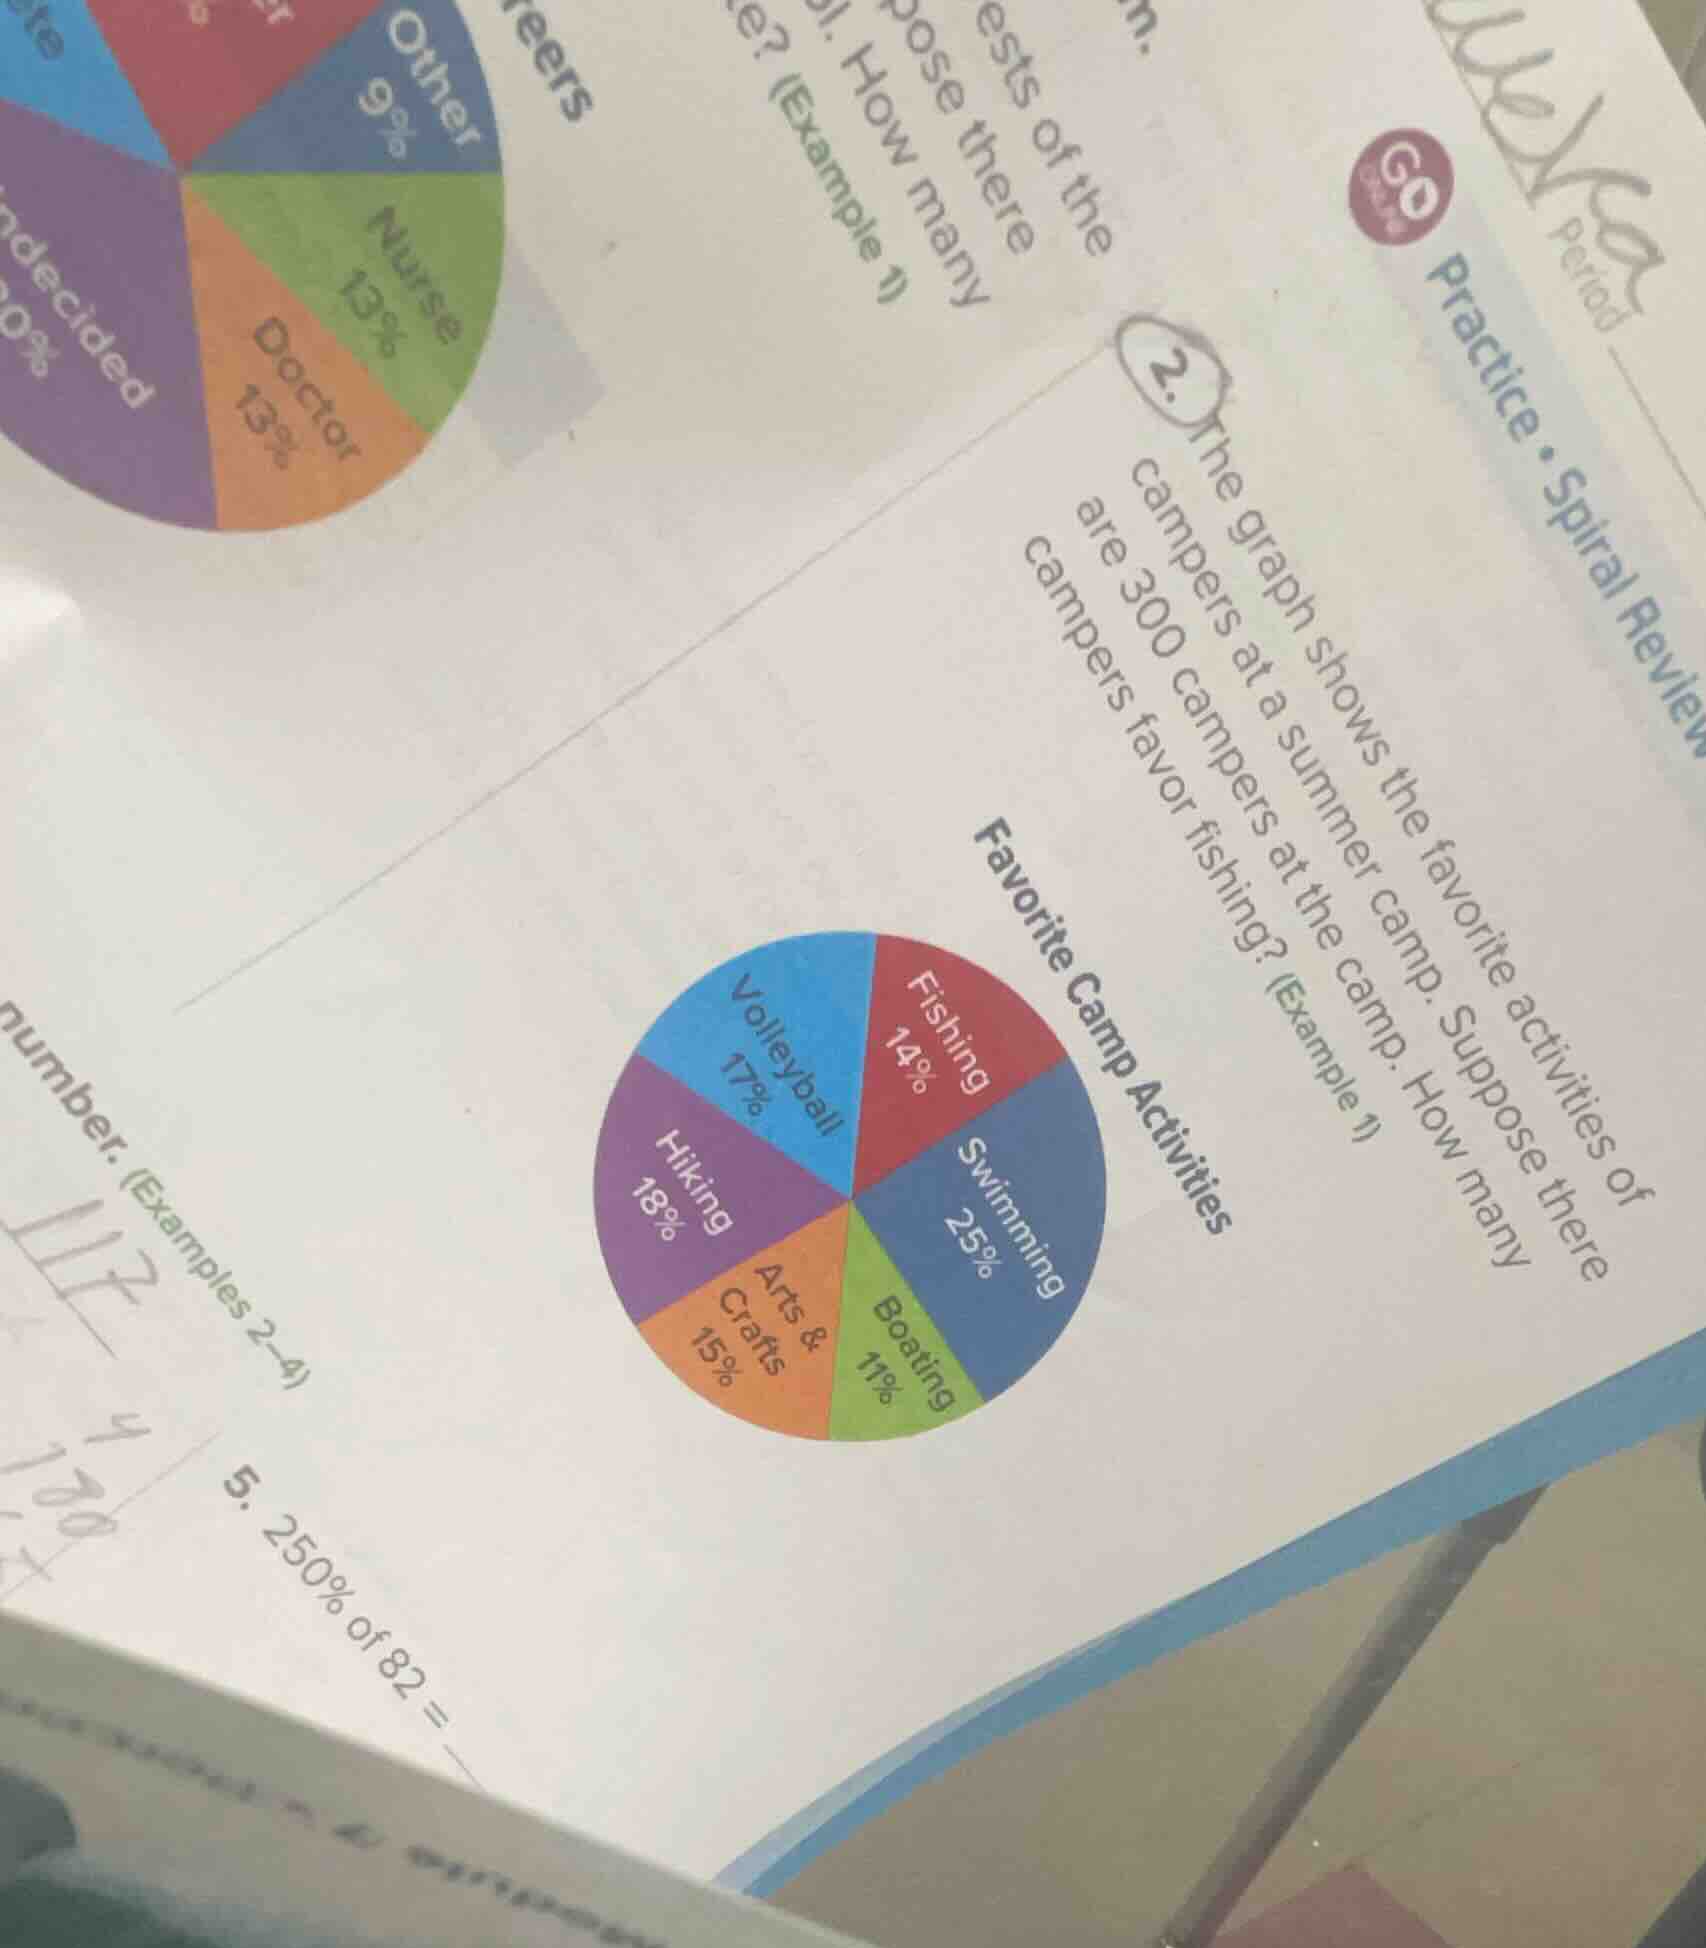
- the graph shows the favorite activities of campers at a summer camp. suppose there are 300 campers at the camp. how many campers favor fishing? (example 1) favorite camp activities fishing 14% swimming 25% boating 11% arts & crafts 15% hiking 18% volleyball 17%
Step1: Identify the percentage for fishing
From the pie chart, the percentage of campers who favor fishing is 14%.
Step2: Calculate the number of campers who favor fishing
To find the number of campers who favor fishing, we multiply the total number of campers (300) by the percentage of campers who favor fishing (14% or 0.14 in decimal form). So the calculation is $300\times0.14$.
Step3: Perform the multiplication
$300\times0.14 = 42$.

Snap & solve any problem in the app
Get step-by-step solutions on Sovi AI
Photo-based solutions with guided steps
Explore more problems and detailed explanations
42