QUESTION IMAGE
Question
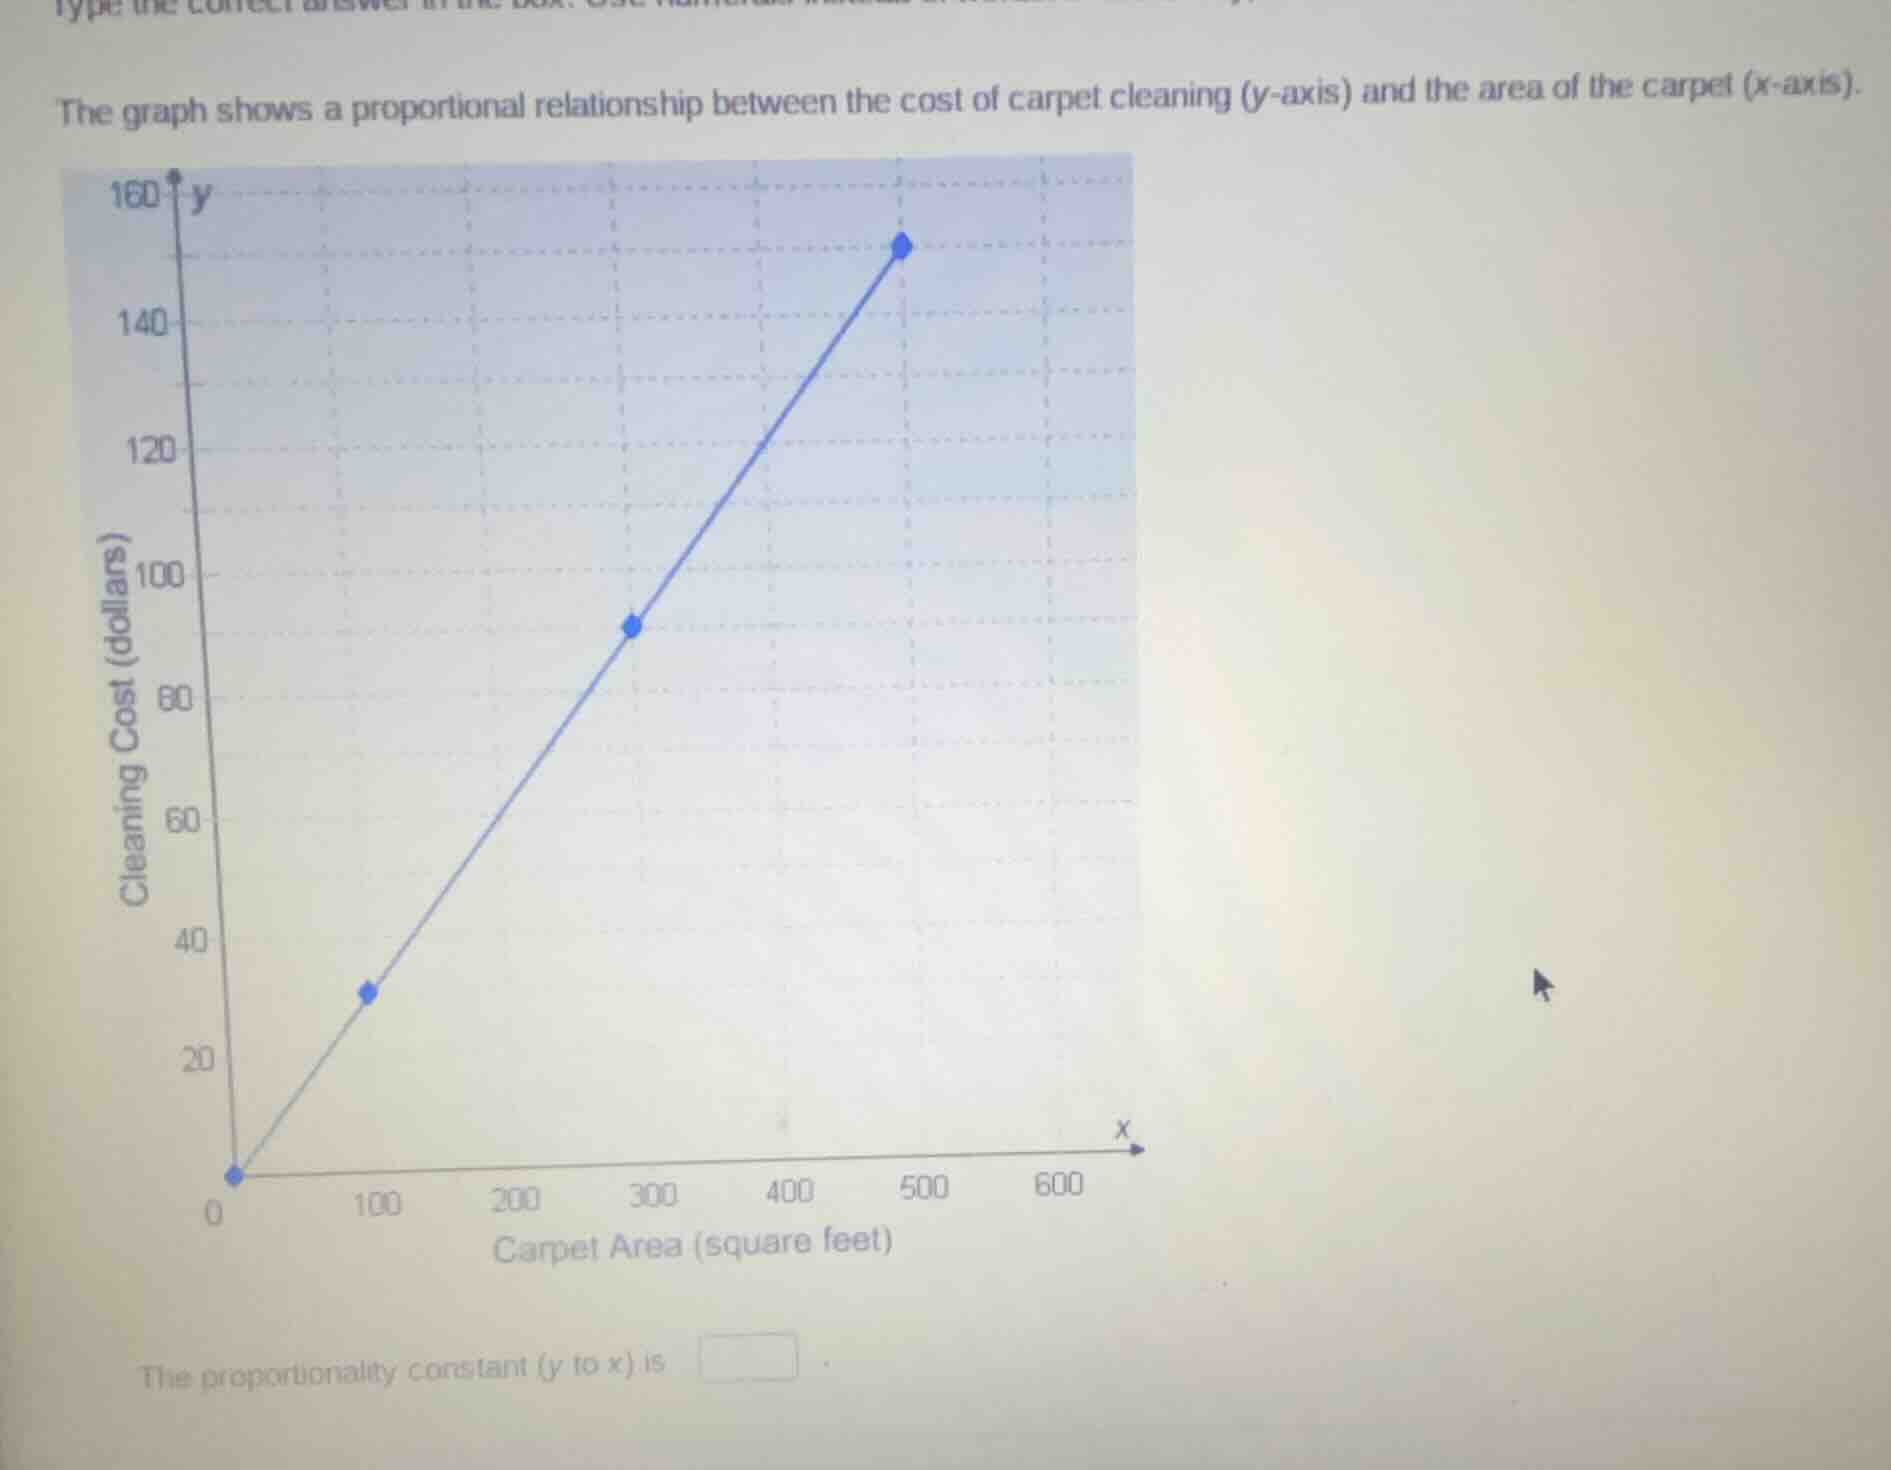
the graph shows a proportional relationship between the cost of carpet cleaning (y-axis) and the area of the carpet (x-axis). the proportionality constant (y to x) is .
Step1: Recall proportional relationship formula
For a proportional relationship \( y = kx \), the constant of proportionality \( k=\frac{y}{x} \).
Step2: Select a point from the graph
Take the point \((500, 150)\) (from the graph, when \( x = 500 \), \( y=150 \)).
Step3: Calculate the proportionality constant
Using \( k=\frac{y}{x} \), substitute \( x = 500 \) and \( y = 150 \). So \( k=\frac{150}{500}=0.3 \). We can check with another point, say \((300, 90)\), \( \frac{90}{300}=0.3 \), which confirms it.

Snap & solve any problem in the app
Get step-by-step solutions on Sovi AI
Photo-based solutions with guided steps
Explore more problems and detailed explanations
\( 0.3 \) (or \(\frac{3}{10}\))