QUESTION IMAGE
Question
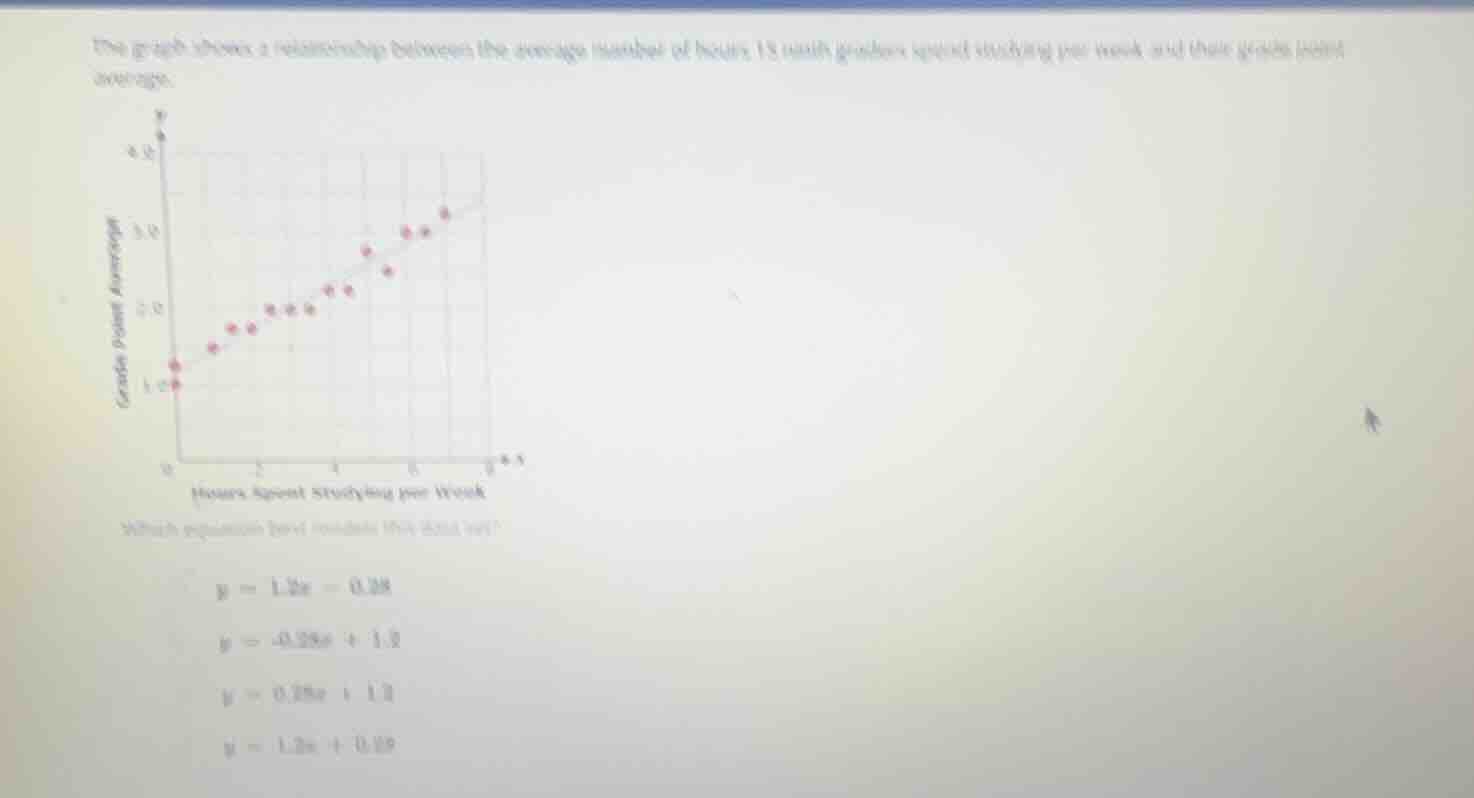
the graph shows a relationship between the average number of hours 15 ninth graders spent studying per week and their grade point average.
which equation best models this data?
$y = 1.2x - 0.28$
$y = 0.28x + 1.2$
$y = 0.28x - 1.2$
$y = 1.2x + 0.28$
Step1: Analyze slope direction
The line of best fit has a positive slope, so we eliminate options with negative slopes (the second option is discarded as it has $-0.28x$).
Step2: Estimate y-intercept
When $x=0$ (0 hours studying), the y-value (grade point average) is around 1.0-1.2. Check remaining options:
- $y=1.2x - 0.28$: When $x=0$, $y=-0.28$ (too low, invalid)
- $y=0.28x + 1.2$: When $x=0$, $y=1.2$ (matches the estimate)
- $y=1.2x + 0.28$: When $x=0$, $y=0.28$ (too low, invalid)
Step3: Verify slope magnitude
For $x=8$, the expected y-value is ~3.2. Substitute into $y=0.28x + 1.2$:
$y=0.28\times8 + 1.2 = 2.24 + 1.2 = 3.44$, which is close to the graph's value. A slope of 1.2 would give $y=1.2\times8+0.28=9.88$, which is far above the graph's maximum y-value of 4.0, so it is invalid.

Snap & solve any problem in the app
Get step-by-step solutions on Sovi AI
Photo-based solutions with guided steps
Explore more problems and detailed explanations
$y = 0.28x + 1.2$