QUESTION IMAGE
Question
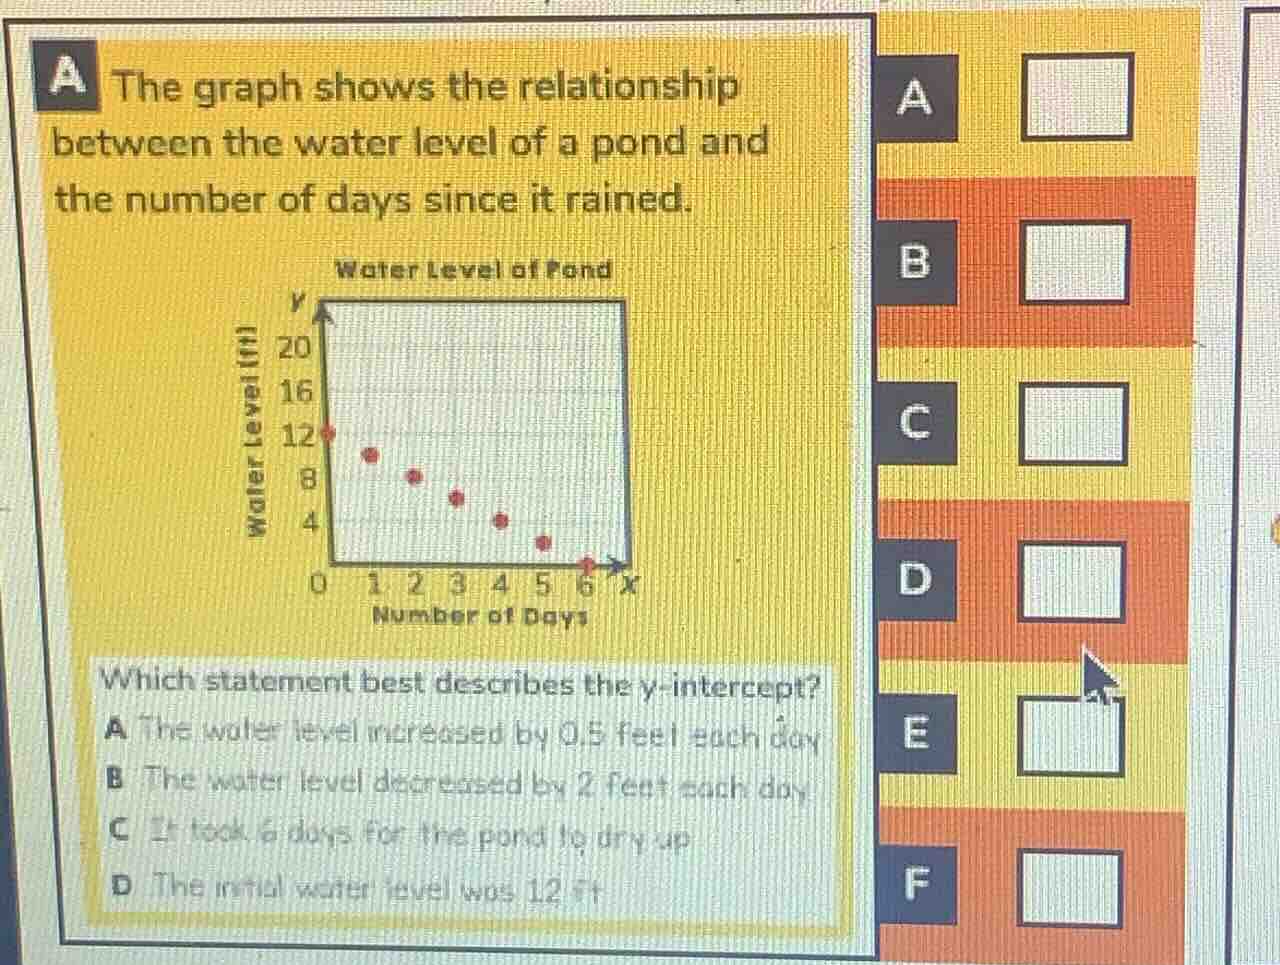
a the graph shows the relationship between the water level of a pond and the number of days since it rained.
water level of pond
which statement best describes the y - intercept?
a the water level increased by 0.5 feet each day
b the water level decreased by 2 feet each day
c it took 6 days for the pond to dry up
d the initial water level was 12 ft
The y-intercept of a graph is the value of y when x=0. On this graph, x represents days since it rained, so x=0 is the initial time right after rain, and the corresponding y-value is 12 feet, which is the starting water level. Option A and B describe the rate of change (slope), not the y-intercept. Option C refers to the x-intercept (when y=0, x=6).

Snap & solve any problem in the app
Get step-by-step solutions on Sovi AI
Photo-based solutions with guided steps
Explore more problems and detailed explanations
D. The initial water level was 12 ft