QUESTION IMAGE
Question
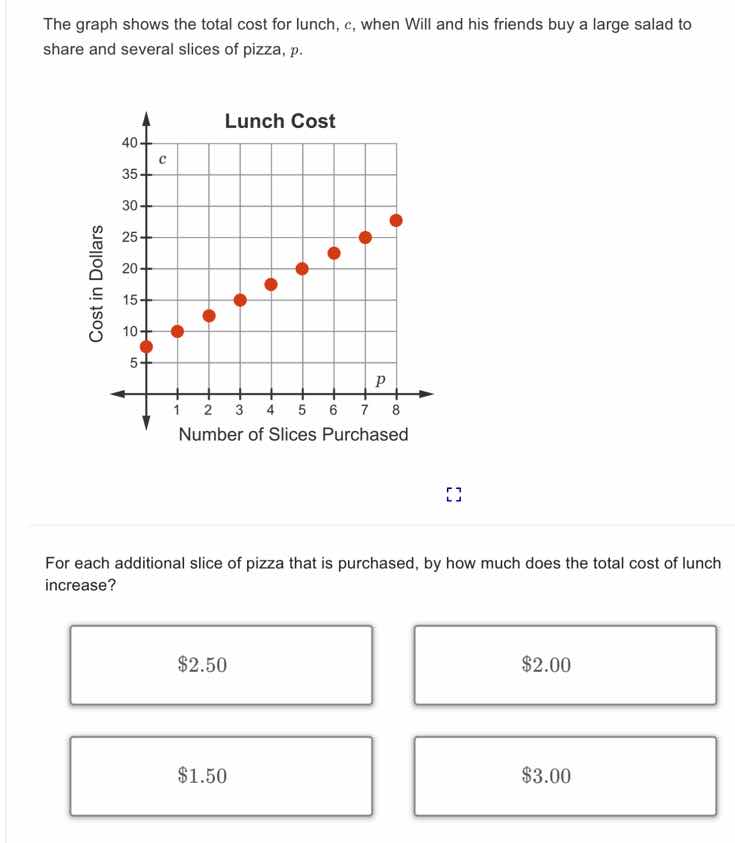
the graph shows the total cost for lunch, c, when will and his friends buy a large salad to share and several slices of pizza, p. graph of lunch cost with p (number of slices purchased) on x - axis and c (cost in dollars) on y - axis, with points plotted for each additional slice of pizza that is purchased, by how much does the total cost of lunch increase? options: $2.50, $2.00, $1.50, $3.00
Step1: Identify two points
Take two consecutive points, e.g., when \( p = 0 \), \( c = 7.5 \) (approx, but better to take \( p = 1 \), \( c = 10 \) and \( p = 2 \), \( c = 12.5 \))? Wait, looking at the graph, when \( p = 0 \), \( c = 7.5 \)? Wait no, the first point (p=0) is around 7.5? Wait no, the first red dot: p=0, c=7.5? Wait no, the y-axis: 5,10,15... Wait, the first dot (p=0) is at c=7.5? Wait no, maybe p=0: c=7.5, p=1: c=10, p=2: c=12.5, p=3: c=15, etc. Wait, the difference between p=1 and p=0: 10 - 7.5 = 2.5? Wait no, maybe p=0: c=7.5, p=1: c=10 (difference 2.5), p=2: c=12.5 (difference 2.5 from p=1), p=3: c=15 (difference 2.5 from p=2). Wait, let's check the coordinates. Let's take p=0, c=7.5; p=1, c=10. The increase is 10 - 7.5 = 2.5? Wait no, maybe the first point (p=0) is c=7.5, p=1: c=10, so the slope (rate of change) is \( \frac{10 - 7.5}{1 - 0} = 2.5 \). Wait, but let's check another pair: p=1 (c=10) and p=2 (c=12.5). \( 12.5 - 10 = 2.5 \). p=2 (12.5) and p=3 (15): 15 - 12.5 = 2.5. So the increase per slice is $2.50.
Step2: Calculate the difference
For each additional slice, the change in c is the slope. Using two points, say (0, 7.5) and (1, 10), the change in c is \( 10 - 7.5 = 2.5 \). Or (1, 10) and (2, 12.5): \( 12.5 - 10 = 2.5 \). So the increase is $2.50.

Snap & solve any problem in the app
Get step-by-step solutions on Sovi AI
Photo-based solutions with guided steps
Explore more problems and detailed explanations
\$2.50