QUESTION IMAGE
Question
graphing
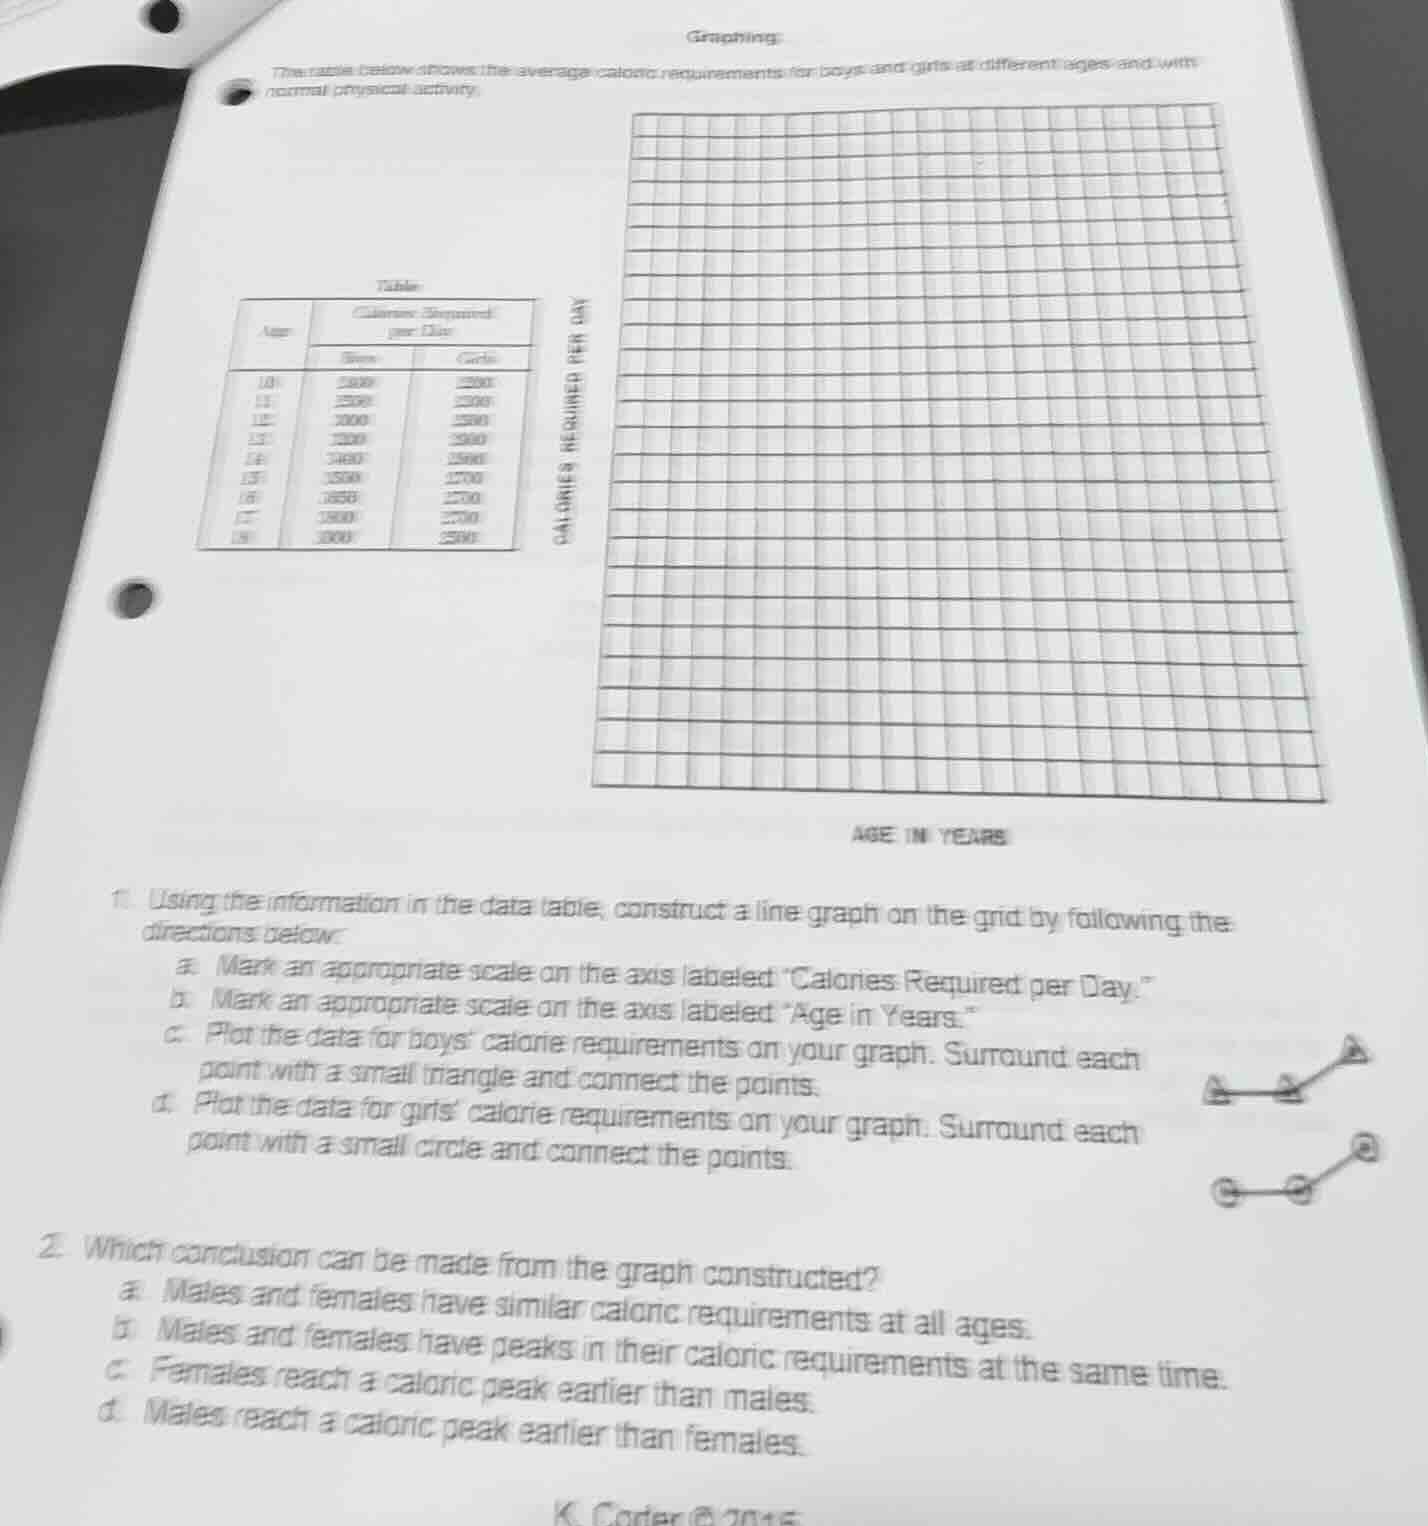
the table below shows the average caloric requirements for boys and girls at different ages and with normal physical activity.
table
| age | calories required per day - boys | calories required per day - girls |
|---|---|---|
| 11 | 2500 | 2200 |
| 12 | 2700 | 2500 |
| 13 | 3200 | 2900 |
| 14 | 3600 | 3000 |
| 15 | 3500 | 2700 |
| 16 | 3050 | 2700 |
| 17 | 3200 | 2700 |
| 18 | 3000 | 2500 |
(grid for graphing with axes: calories required per day (y - axis) and age in years (x - axis))
- using the information in the data table, construct a line graph on the grid by following the directions below:
a. mark an appropriate scale on the axis labeled \calories required per day.\
b. mark an appropriate scale on the axis labeled \age in years.\
c. plot the data for boys’ calorie requirements on your graph. surround each point with a small triangle and connect the points.
d. plot the data for girls’ calorie requirements on your graph. surround each point with a small circle and connect the points.
- which conclusion can be made from the graph constructed?
a. males and females have similar caloric requirements at all ages.
b. males and females have peaks in their caloric requirements at the same time.
c. females reach a caloric peak earlier than males.
d. males reach a caloric peak earlier than females.
1. Constructing the Line Graph (Step-by-Step for Graphing)
Step 1: Scale for "Age in Years" Axis
- Explanation: Determine age range (10 - 18 years). Mark x - axis with ages 10, 11, 12, 13, 14, 15, 16, 17, 18 at equal intervals.
- Expression: X - axis labels: 10, 11, 12, 13, 14, 15, 16, 17, 18.
Step 2: Scale for "Calories Required per Day" Axis
- Explanation: Find calorie range (1200 - 3000). Choose a scale (e.g., 200 calories per grid line). Mark y - axis from 1200 to 3000 with intervals of 200.
- Expression: Y - axis: 1200, 1400, 1600, 1800, 2000, 2200, 2400, 2600, 2800, 3000.
Step 3: Plot Boys' Data
- Explanation: For each age, plot (age, boys' calories) with triangles. E.g., (10, 2000), (11, 2500), (12, 3000), (13, 3200), (14, 3460), (15, 3500), (16, 3650), (17, 3800), (18, 3000).
- Expression: Plot points: (10, 2000) △, (11, 2500) △, (12, 3000) △, (13, 3200) △, (14, 3460) △, (15, 3500) △, (16, 3650) △, (17, 3800) △, (18, 3000) △. Connect with lines.
Step 4: Plot Girls' Data
- Explanation: For each age, plot (age, girls' calories) with circles. E.g., (10, 1200), (11, 2200), (12, 2500), (13, 2900), (14, 3000), (15, 2700), (16, 2700), (17, 2700), (18, 2500).
- Expression: Plot points: (10, 1200) ○, (11, 2200) ○, (12, 2500) ○, (13, 2900) ○, (14, 3000) ○, (15, 2700) ○, (16, 2700) ○, (17, 2700) ○, (18, 2500) ○. Connect with lines.
2. Answering the Conclusion Question (Answer - Explanation Format)
- Option a: Males and females have different calorie requirements (e.g., 10 - year - old boys need 2000, girls 1200), so a is wrong.
- Option b: Males' peak is around 17, females' peak is around 14. Not same time, so b is wrong.
- Option c: Females peak around 14, males around 17. So females reach peak earlier, c is correct.
- Option d: Opposite of c, so d is wrong.

Snap & solve any problem in the app
Get step-by-step solutions on Sovi AI
Photo-based solutions with guided steps
Explore more problems and detailed explanations
c. Females reach a caloric peak earlier than males.