QUESTION IMAGE
Question
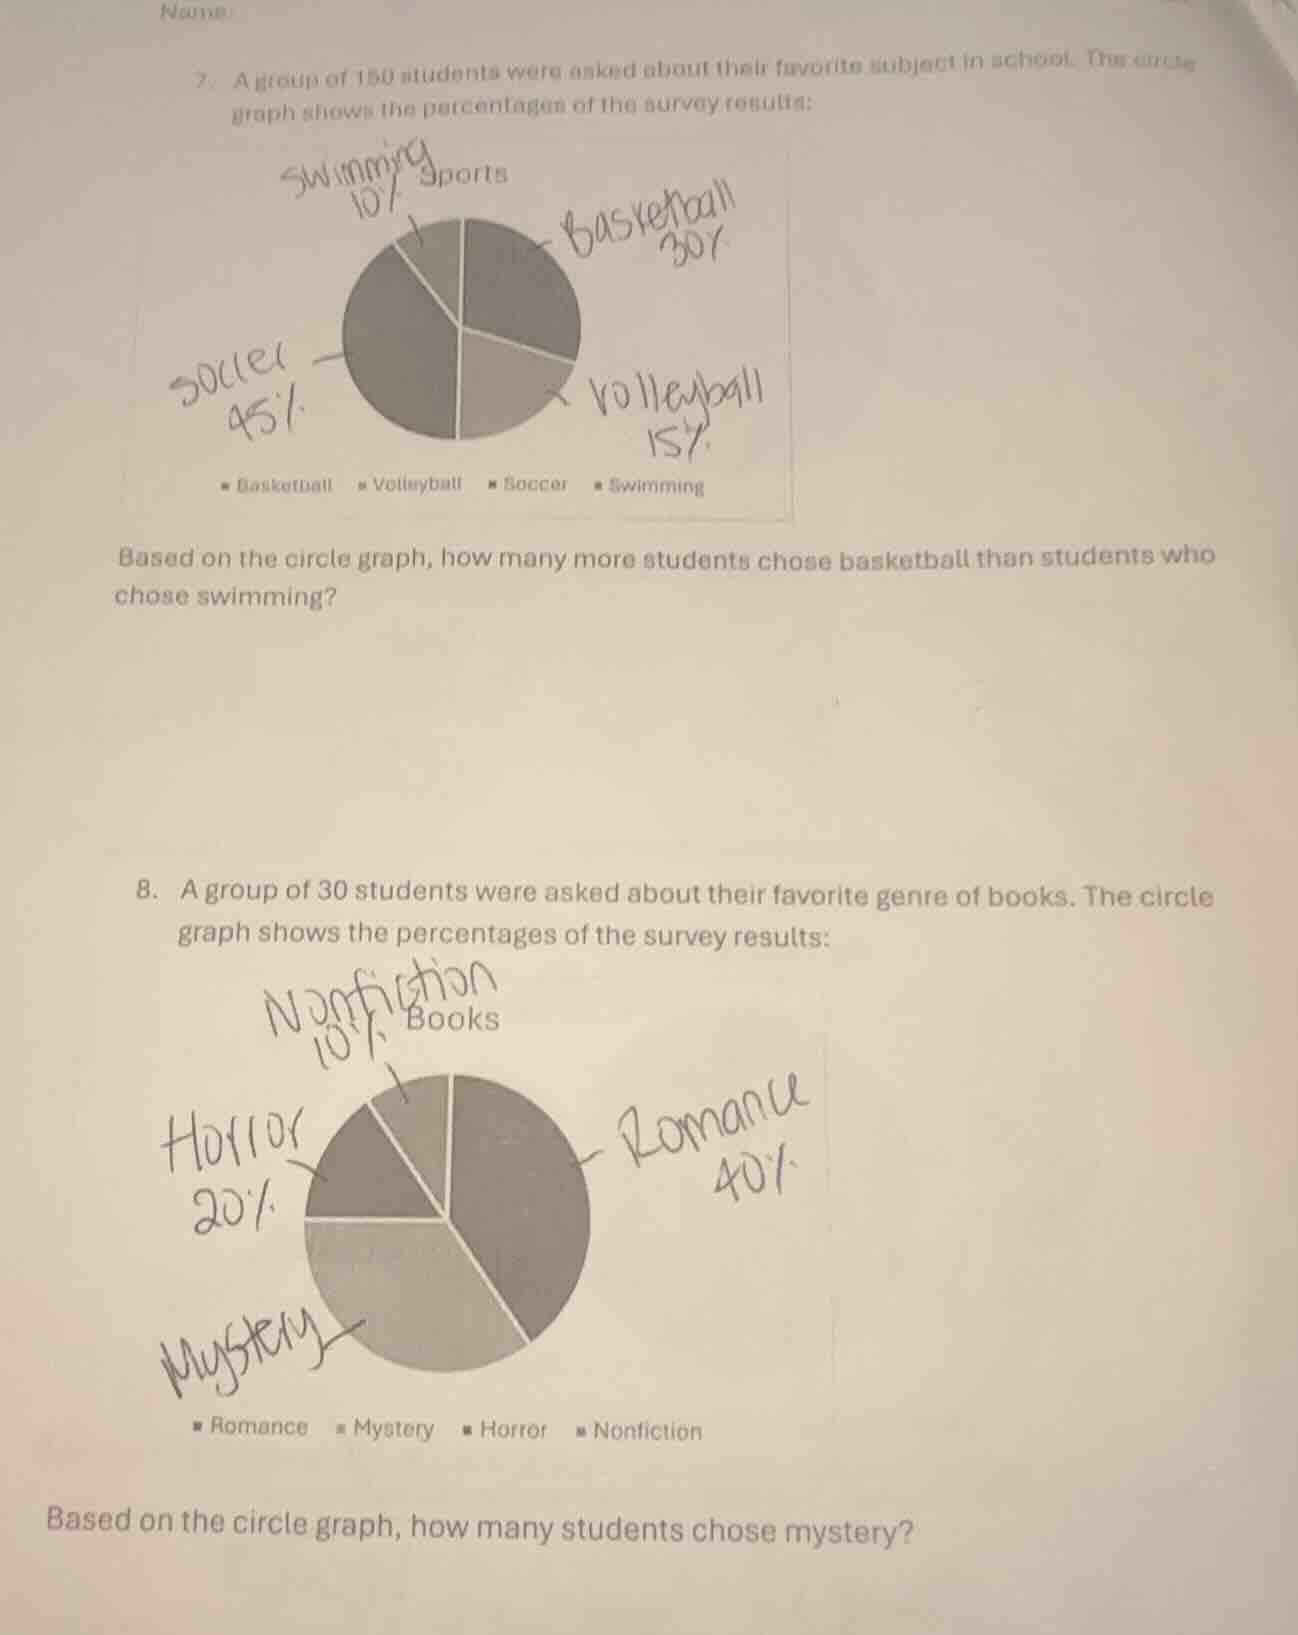
- a group of 150 students were asked about their favorite subject in school. the circle graph shows the percentages of the survey results: (pie chart with labels: swimming 10%, basketball 30%, volleyball 15%, soccer 45%) based on the circle graph, how many more students chose basketball than students who chose swimming? 8. a group of 30 students were asked about their favorite genre of books. the circle graph shows the percentages of the survey results: (pie chart with labels: nonfiction 10%, romance 40%, horror 20%, mystery (remaining percentage)) based on the circle graph, how many students chose mystery?
Response
Question 7
Step1: Find number of basketball students
Total students = 150, Basketball % = 30%
Number of basketball students = \( 150 \times \frac{30}{100} = 45 \)
Step2: Find number of swimming students
Swimming % = 10%
Number of swimming students = \( 150 \times \frac{10}{100} = 15 \)
Step3: Find the difference
Difference = 45 - 15 = 30
Step1: Calculate total percentage of known genres
Romance: 40%, Horror: 20%, Nonfiction: 10%
Total known % = 40 + 20 + 10 = 70%
Step2: Find percentage of mystery
Mystery % = 100 - 70 = 30%
Step3: Calculate number of mystery students
Total students = 30
Number of mystery students = \( 30 \times \frac{30}{100} = 9 \)

Snap & solve any problem in the app
Get step-by-step solutions on Sovi AI
Photo-based solutions with guided steps
Explore more problems and detailed explanations
30