QUESTION IMAGE
Question
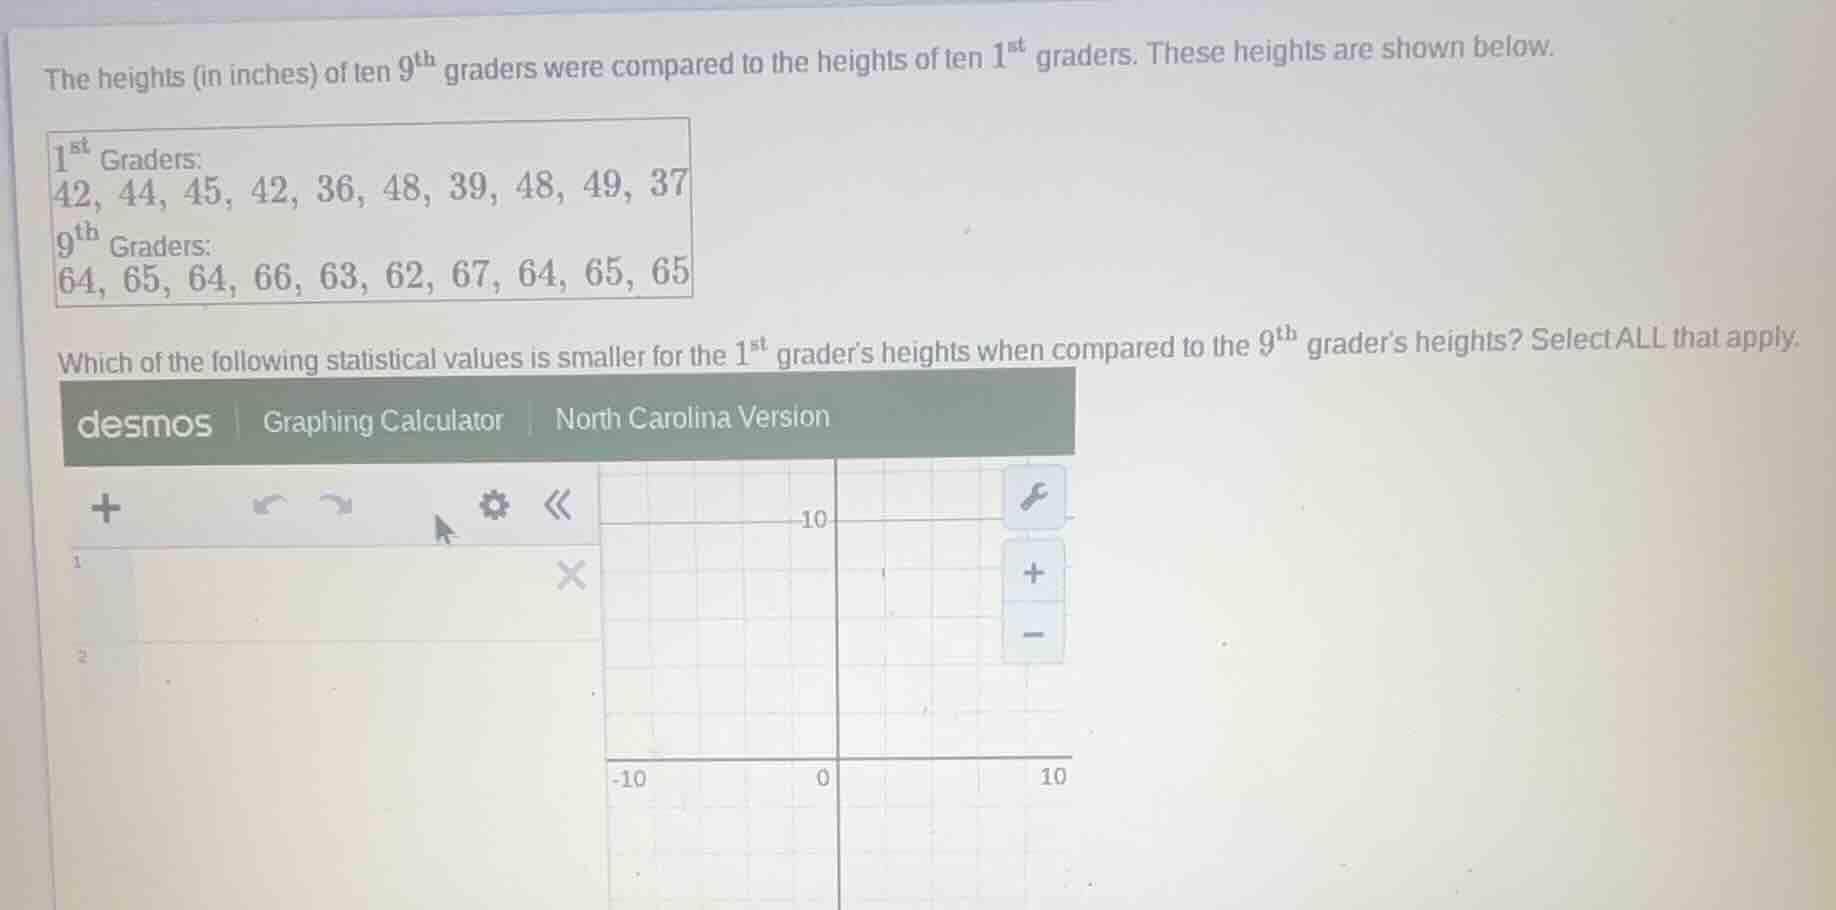
the heights (in inches) of ten $9^{\text{th}}$ graders were compared to the heights of ten $1^{\text{st}}$ graders. these heights are shown below.\
\
$1^{\text{st}}$ graders:\
42, 44, 45, 42, 36, 48, 39, 48, 49, 37\
$9^{\text{th}}$ graders:\
64, 65, 64, 66, 63, 62, 67, 64, 65, 65\
\
which of the following statistical values is smaller for the $1^{\text{st}}$ grader’s heights when compared to the $9^{\text{th}}$ grader’s heights? select all that apply.\
\
(desmos graphing calculator interface shown with grid, but relevant for potential plotting, though problem focuses on stats comparison)
To solve this, we analyze measures like mean, median, range, and standard deviation for both groups.
Step 1: Organize Data (1st Graders)
1st Graders (sorted): \( 36, 37, 39, 42, 42, 44, 45, 48, 48, 49 \)
- Mean: \( \frac{36 + 37 + 39 + 42 + 42 + 44 + 45 + 48 + 48 + 49}{10} = \frac{420}{10} = 42 \)
- Median: Middle values (\( 42, 44 \)) → \( \frac{42 + 44}{2} = 43 \)
- Range: \( 49 - 36 = 13 \)
- Standard Deviation (approximate): Calculate squared deviations, average, then square - root. Deviations from mean (\( 42 \)): \( (-6)^2, (-5)^2, (-3)^2, 0^2, 0^2, 2^2, 3^2, 6^2, 6^2, 7^2 \). Sum: \( 36 + 25 + 9 + 0 + 0 + 4 + 9 + 36 + 36 + 49 = 204 \). Variance: \( \frac{204}{10} = 20.4 \). SD: \( \sqrt{20.4} \approx 4.52 \).
Step 2: Organize Data (9th Graders)
9th Graders (sorted): \( 62, 63, 64, 64, 64, 65, 65, 65, 66, 67 \)
- Mean: \( \frac{62 + 63 + 64 + 64 + 64 + 65 + 65 + 65 + 66 + 67}{10} = \frac{645}{10} = 64.5 \)
- Median: Middle values (\( 64, 65 \)) → \( \frac{64 + 65}{2} = 64.5 \)
- Range: \( 67 - 62 = 5 \)
- Standard Deviation (approximate): Deviations from mean (\( 64.5 \)): \( (-2.5)^2, (-1.5)^2, (-0.5)^2, (-0.5)^2, (-0.5)^2, 0.5^2, 0.5^2, 0.5^2, 1.5^2, 2.5^2 \). Sum: \( 6.25 + 2.25 + 0.25 + 0.25 + 0.25 + 0.25 + 0.25 + 0.25 + 2.25 + 6.25 = 18.5 \). Variance: \( \frac{18.5}{10} = 1.85 \). SD: \( \sqrt{1.85} \approx 1.36 \). Wait, no—wait, 9th graders’ data is more clustered, but wait, 1st graders have a larger range? Wait, no, 1st graders’ range is \( 13 \), 9th graders’ range is \( 5 \). Wait, no, mean: 1st graders’ mean (\( 42 \)) is less than 9th graders’ (\( 64.5 \)). Median: 1st graders’ median (\( 43 \)) is less than 9th graders’ (\( 64.5 \)). Wait, but range: 1st graders’ range is \( 13 \), 9th graders’ is \( 5 \)—so 1st graders’ range is larger? Wait, no, the question is which is smaller for 1st graders. Wait, no—wait, 1st graders’ mean (42) < 9th graders’ mean (64.5). 1st graders’ median (43) < 9th graders’ median (64.5). 1st graders’ standard deviation (≈4.52) is larger than 9th graders’ (≈1.36)? Wait, no—wait, 9th graders’ data is more consistent. Wait, no, 1st graders have a wider spread? Wait, no, 9th graders’ range is 5, 1st graders’ is 13—so 1st graders’ range is larger. Wait, but the question is which statistical values are smaller for 1st graders. Wait, no—wait, mean: 1st (42) < 9th (64.5). Median: 1st (43) < 9th (64.5). Wait, but standard deviation: 1st (≈4.52) vs 9th (≈1.36)—so 1st is larger. Range: 1st (13) vs 9th (5)—1st is larger. Wait, no—wait, maybe I miscalculated 9th graders’ mean. Let’s recalculate 9th graders’ sum: \( 62 + 63 = 125 \); \( 125 + 64 = 189 \); \( 189 + 64 = 253 \); \( 253 + 64 = 317 \); \( 317 + 65 = 382 \); \( 382 + 65 = 447 \); \( 447 + 65 = 512 \); \( 512 + 66 = 578 \); \( 578 + 67 = 645 \). Yes, mean is 64.5. So mean and median of 1st graders are smaller. Wait, but the question says “select ALL that apply.” Let’s confirm:
- Mean: 1st (42) < 9th (64.5) → smaller.
- Median: 1st (43) < 9th (64.5) → smaller.
- Range: 1st (13) > 9th (5) → not smaller.
- Standard Deviation: 1st (≈4.52) > 9th (≈1.36) → not smaller.
So the statistical values smaller for 1st graders are mean and median.
(Note: If options included mean, median, etc., those would be the answers. Since the problem asks to “select ALL that apply,” and based on calculations, mean and median of 1st graders are smaller than 9th graders’.)

Snap & solve any problem in the app
Get step-by-step solutions on Sovi AI
Photo-based solutions with guided steps
Explore more problems and detailed explanations
To solve this, we analyze measures like mean, median, range, and standard deviation for both groups.
Step 1: Organize Data (1st Graders)
1st Graders (sorted): \( 36, 37, 39, 42, 42, 44, 45, 48, 48, 49 \)
- Mean: \( \frac{36 + 37 + 39 + 42 + 42 + 44 + 45 + 48 + 48 + 49}{10} = \frac{420}{10} = 42 \)
- Median: Middle values (\( 42, 44 \)) → \( \frac{42 + 44}{2} = 43 \)
- Range: \( 49 - 36 = 13 \)
- Standard Deviation (approximate): Calculate squared deviations, average, then square - root. Deviations from mean (\( 42 \)): \( (-6)^2, (-5)^2, (-3)^2, 0^2, 0^2, 2^2, 3^2, 6^2, 6^2, 7^2 \). Sum: \( 36 + 25 + 9 + 0 + 0 + 4 + 9 + 36 + 36 + 49 = 204 \). Variance: \( \frac{204}{10} = 20.4 \). SD: \( \sqrt{20.4} \approx 4.52 \).
Step 2: Organize Data (9th Graders)
9th Graders (sorted): \( 62, 63, 64, 64, 64, 65, 65, 65, 66, 67 \)
- Mean: \( \frac{62 + 63 + 64 + 64 + 64 + 65 + 65 + 65 + 66 + 67}{10} = \frac{645}{10} = 64.5 \)
- Median: Middle values (\( 64, 65 \)) → \( \frac{64 + 65}{2} = 64.5 \)
- Range: \( 67 - 62 = 5 \)
- Standard Deviation (approximate): Deviations from mean (\( 64.5 \)): \( (-2.5)^2, (-1.5)^2, (-0.5)^2, (-0.5)^2, (-0.5)^2, 0.5^2, 0.5^2, 0.5^2, 1.5^2, 2.5^2 \). Sum: \( 6.25 + 2.25 + 0.25 + 0.25 + 0.25 + 0.25 + 0.25 + 0.25 + 2.25 + 6.25 = 18.5 \). Variance: \( \frac{18.5}{10} = 1.85 \). SD: \( \sqrt{1.85} \approx 1.36 \). Wait, no—wait, 9th graders’ data is more clustered, but wait, 1st graders have a larger range? Wait, no, 1st graders’ range is \( 13 \), 9th graders’ range is \( 5 \). Wait, no, mean: 1st graders’ mean (\( 42 \)) is less than 9th graders’ (\( 64.5 \)). Median: 1st graders’ median (\( 43 \)) is less than 9th graders’ (\( 64.5 \)). Wait, but range: 1st graders’ range is \( 13 \), 9th graders’ is \( 5 \)—so 1st graders’ range is larger? Wait, no, the question is which is smaller for 1st graders. Wait, no—wait, 1st graders’ mean (42) < 9th graders’ mean (64.5). 1st graders’ median (43) < 9th graders’ median (64.5). 1st graders’ standard deviation (≈4.52) is larger than 9th graders’ (≈1.36)? Wait, no—wait, 9th graders’ data is more consistent. Wait, no, 1st graders have a wider spread? Wait, no, 9th graders’ range is 5, 1st graders’ is 13—so 1st graders’ range is larger. Wait, but the question is which statistical values are smaller for 1st graders. Wait, no—wait, mean: 1st (42) < 9th (64.5). Median: 1st (43) < 9th (64.5). Wait, but standard deviation: 1st (≈4.52) vs 9th (≈1.36)—so 1st is larger. Range: 1st (13) vs 9th (5)—1st is larger. Wait, no—wait, maybe I miscalculated 9th graders’ mean. Let’s recalculate 9th graders’ sum: \( 62 + 63 = 125 \); \( 125 + 64 = 189 \); \( 189 + 64 = 253 \); \( 253 + 64 = 317 \); \( 317 + 65 = 382 \); \( 382 + 65 = 447 \); \( 447 + 65 = 512 \); \( 512 + 66 = 578 \); \( 578 + 67 = 645 \). Yes, mean is 64.5. So mean and median of 1st graders are smaller. Wait, but the question says “select ALL that apply.” Let’s confirm:
- Mean: 1st (42) < 9th (64.5) → smaller.
- Median: 1st (43) < 9th (64.5) → smaller.
- Range: 1st (13) > 9th (5) → not smaller.
- Standard Deviation: 1st (≈4.52) > 9th (≈1.36) → not smaller.
So the statistical values smaller for 1st graders are mean and median.
(Note: If options included mean, median, etc., those would be the answers. Since the problem asks to “select ALL that apply,” and based on calculations, mean and median of 1st graders are smaller than 9th graders’.)